Fewer people are walking into restaurants this year, and the slowdown is showing up first at the front door. Fast food traffic fell 4.4% year over year in May 2026, its worst month of the year so far, according to Placer.ai data reported by Restaurant Dive. Of the first five months of 2026, only February posted a year-over-year gain in quick-service visits.
If you run a restaurant, a bar, or any venue that lives on walk-in demand, that number is not just an industry headline. It is a warning about the one thing you can control: what happens at your own entrance. When traffic tightens, guessing gets expensive. This is the moment to actually measure your restaurant foot traffic and turn it into decisions you can act on this week.
The 2026 traffic story: fewer visits, pickier guests
The headline decline hides a more useful story underneath. The same Placer.ai analysis found that short visits under 10 minutes, which are usually off-premise pickup and drive-thru occasions, dropped 6.8% in May. Meanwhile full-service traffic actually rose 0.7% after two months of declines. Ezra Carmel, a content writer at Placer.ai, noted that elevated fuel costs may be reshaping how people approach their favorite chains, with guests conserving trips and leaning toward sit-down visits.
Zoom into the second quarter and the split gets sharper. Placer.ai reported that Chipotle grew traffic 4.7% year over year in Q2 2026 while McDonald's visits fell 4.5%. Same category, same economy, opposite results. Fast-casual brands leaning into food quality and differentiation held their guests, while chains competing mostly on price struggled to keep people coming back.
Here is the takeaway for an independent operator: there is no single "restaurant traffic" trend that applies to your four walls. The averages are moving in different directions depending on format, daypart, and how you win guests. The only way to know which story is playing out at your location is to measure it.
Why industry averages hide what is happening at your door
National traffic reports are useful context. They are terrible operating tools. A 4.4% category decline tells you the weather in the industry. It tells you nothing about whether your Friday dinner rush is up, flat, or quietly leaking guests.
Most restaurants only look at two numbers: sales and covers. Both are lagging, and both miss the people who mattered most, the ones who walked past, glanced in, and kept going. Your point-of-sale system counts the guests who ordered. It cannot count the family that peeked at the wait, the two people who left because no one greeted them, or the lunch crowd that thinned out because the line looked long.
That blind spot is the gap between traffic and conversion. In a restaurant, your conversion rate is the share of people who enter and actually become a seated table or a paid ticket. When you only watch sales, a slow week looks the same whether fewer people came in or the same crowd walked out unserved. Those are two completely different problems with two completely different fixes.
What restaurant foot traffic data actually reveals
Counting the people who come through your door, and pairing that count with your POS, unlocks a handful of decisions that directly protect revenue when the market is soft.
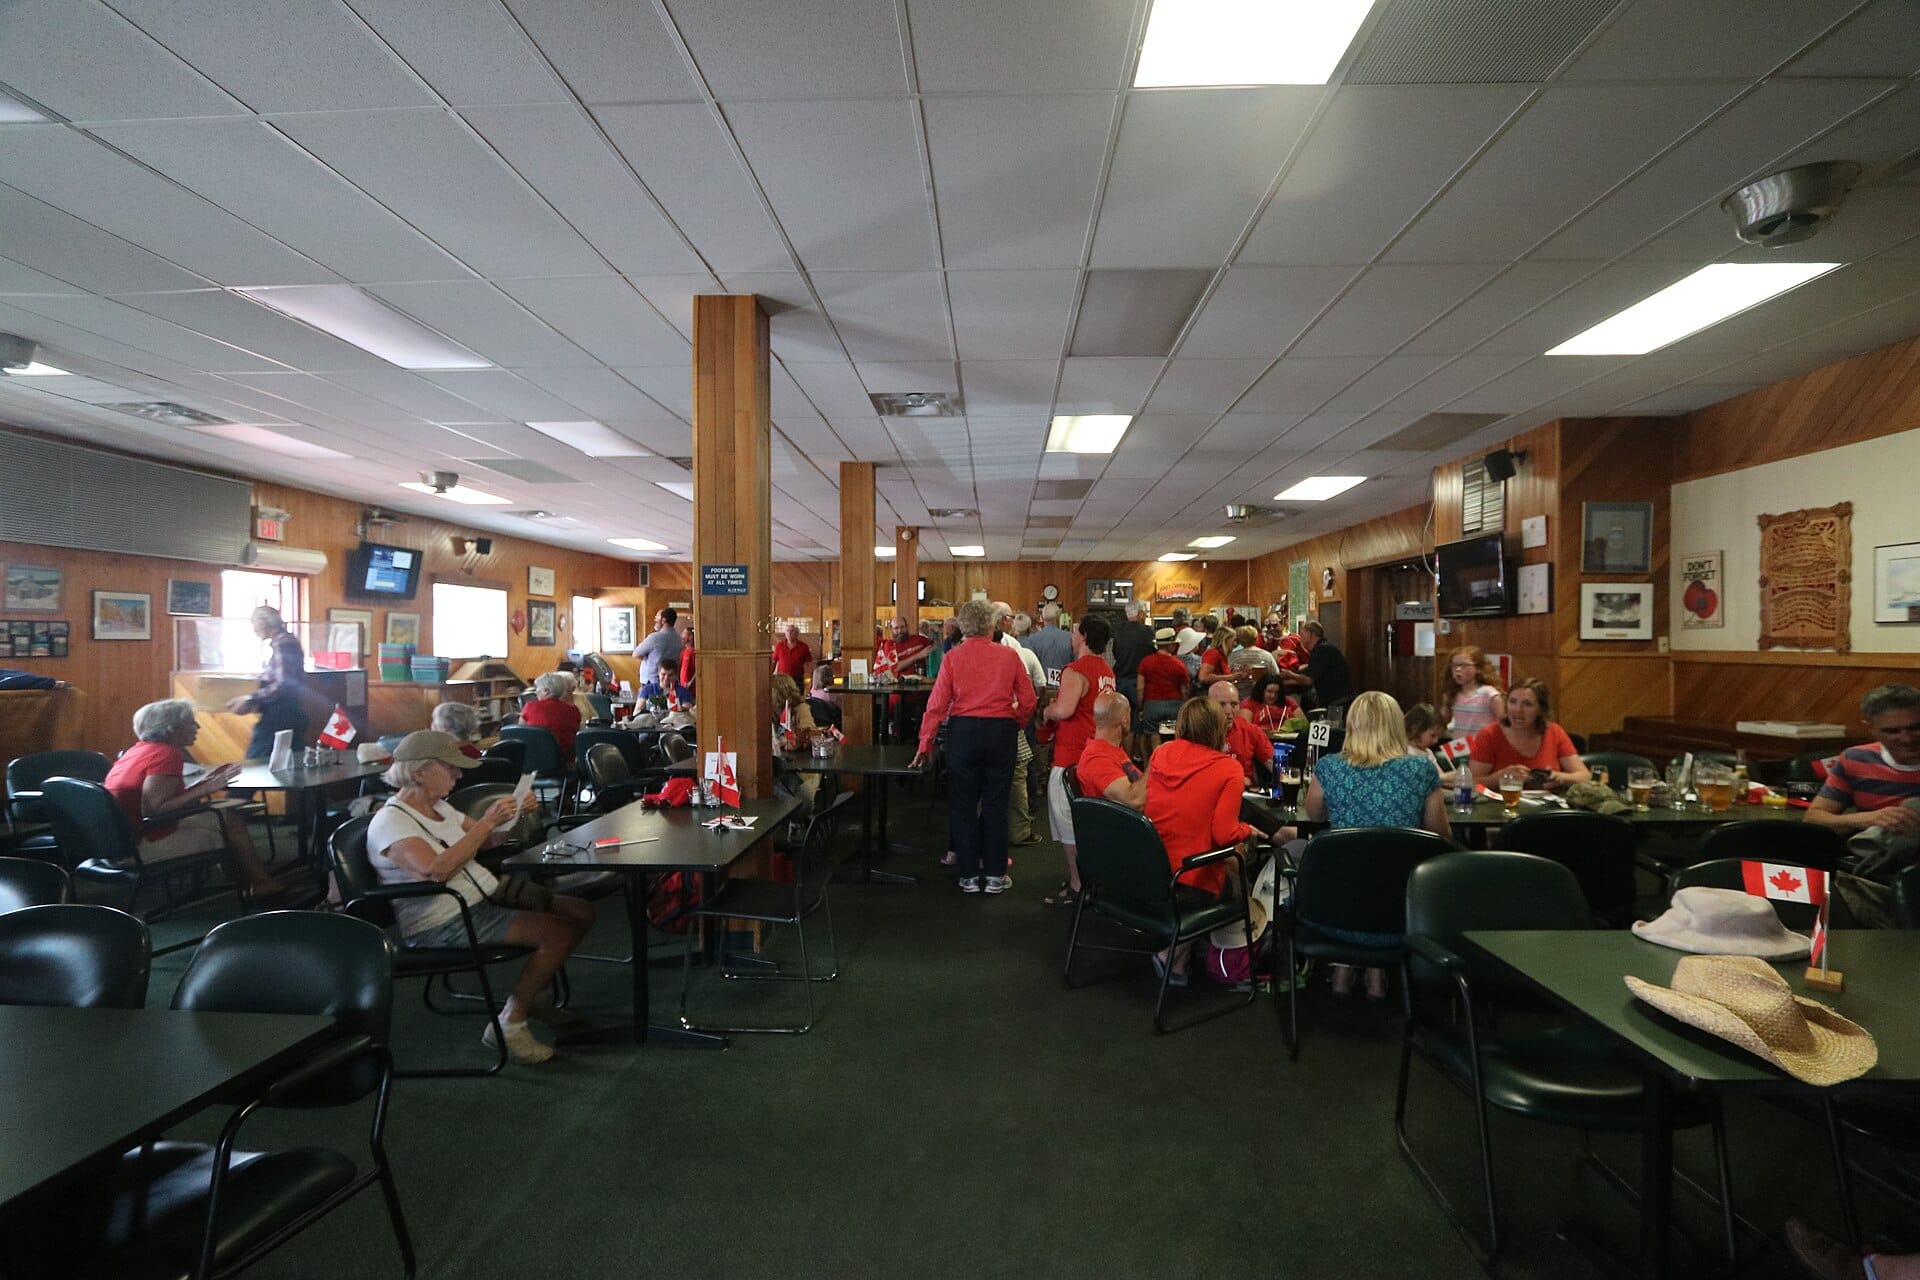
Capture rate: are you converting the crowd outside?
If you sit in a mall, a downtown strip, or an airport concourse, a huge share of your potential guests are the people already walking past. Counting entries against your sales shows your capture and conversion rate, so you can see whether a slow night was a demand problem (fewer people around) or an execution problem (plenty of people, but they did not come in or did not stay). One needs a marketing fix. The other needs a host at the door, faster seating, or a clearer menu out front.
Peak-hour staffing that matches real demand
Labor is one of the largest controllable costs in any restaurant, and schedules built on habit almost never match how guests actually arrive. When you can see your traffic curve hour by hour, you can staff the rush before it hits and taper the slow stretches, without adding to your total labor budget. Understaffing during a peak is not a small miss: guests wait, walk out, and do not come back. The same logic that powers retail peak hour staffing applies cleanly to a dining room or bar.
Marketing and promo impact you can actually prove
You ran a happy-hour push, a local ad, or a new LTO. Did it bring people in? Sales alone cannot tell you, because sales blend too many factors. Foot traffic is the leading indicator. If a promo lifted door traffic 20% but sales only moved 5%, the offer drew a crowd your team did not convert. If traffic never moved, the message did not land. Either way you get a clear answer instead of a guess.
The dine-in versus off-premise split
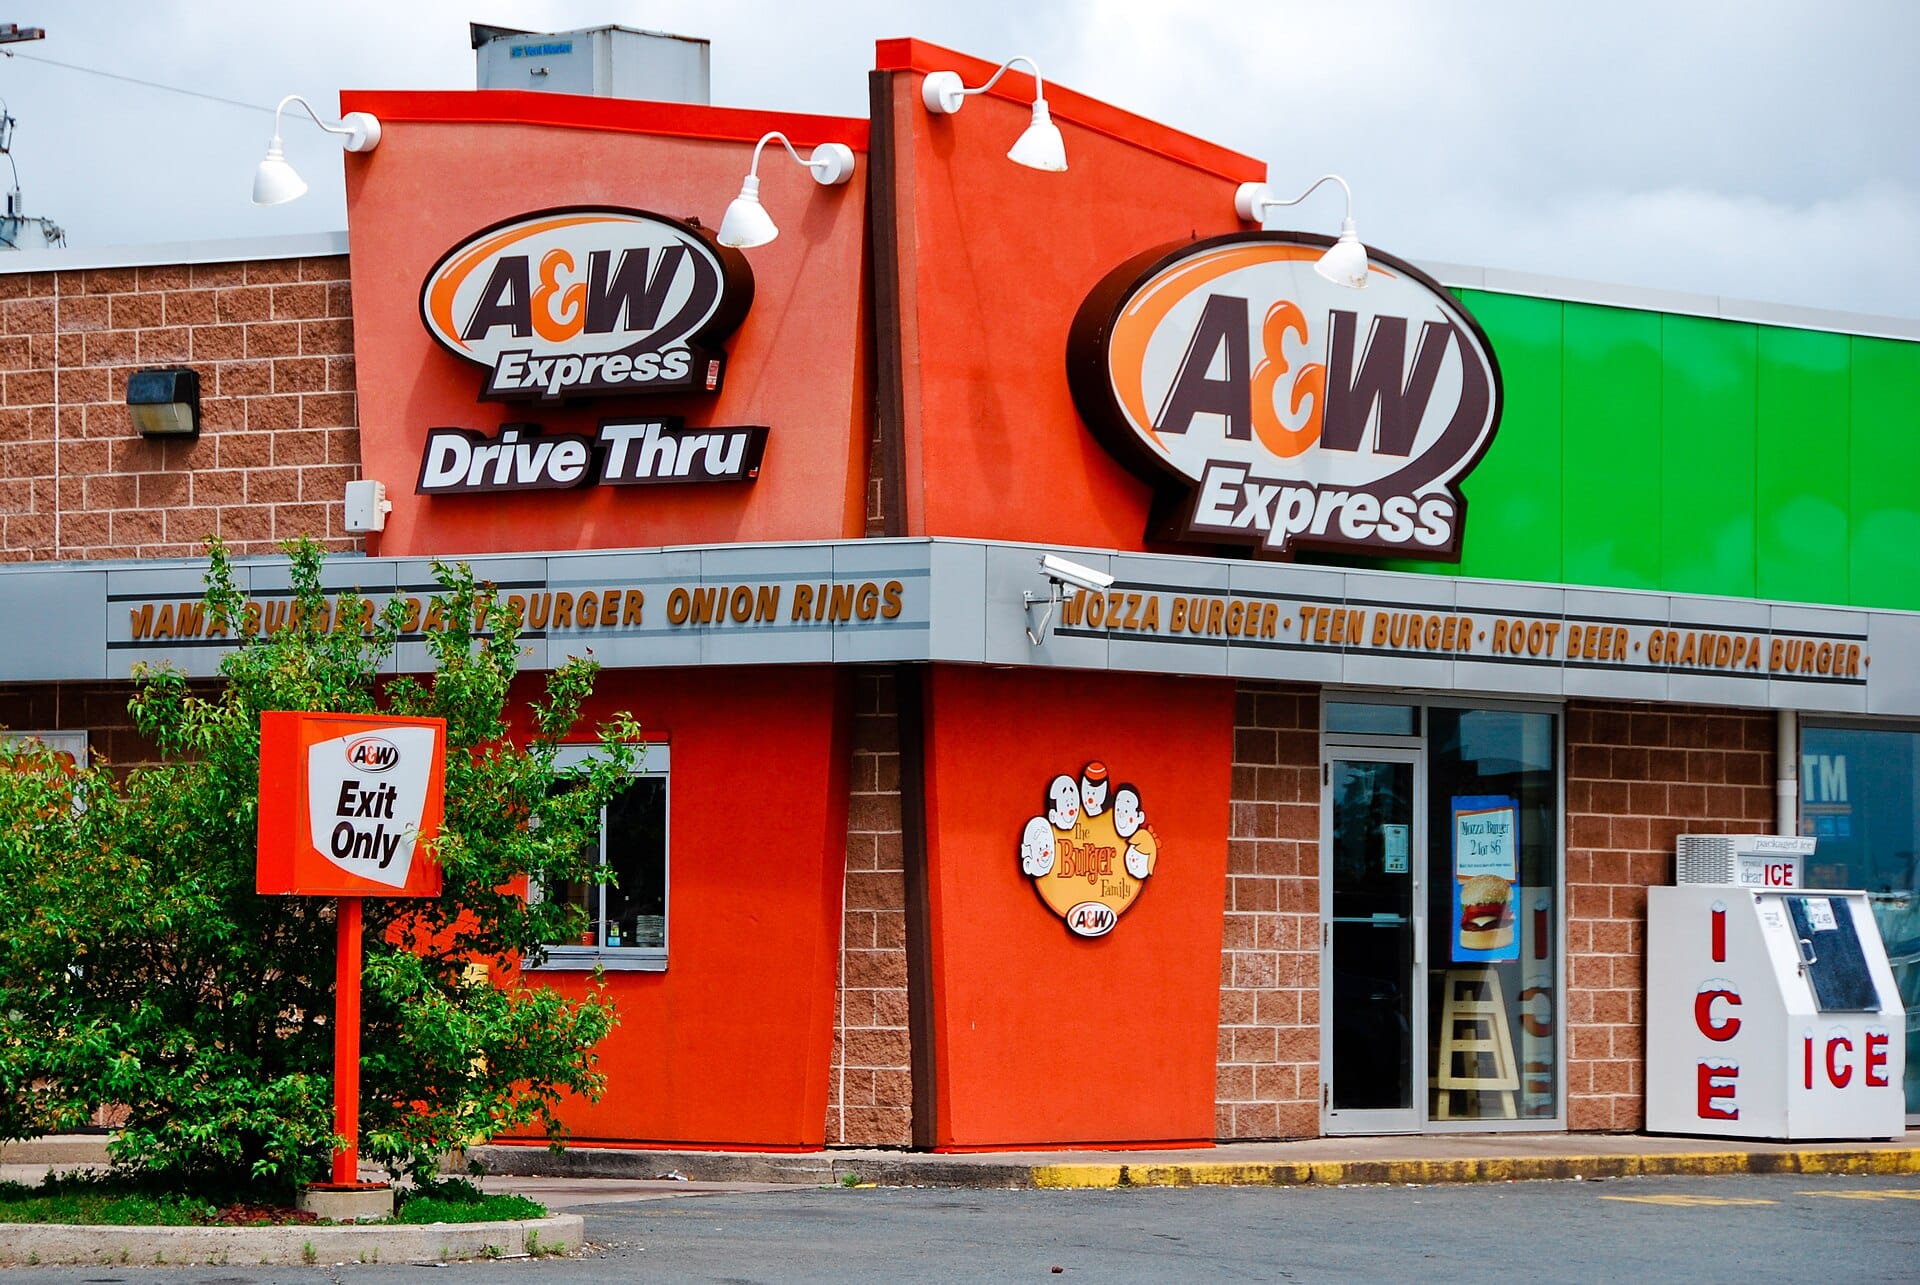
With short off-premise visits sliding and dine-in holding up, the balance of your business may be shifting under you. Traffic data at the door, read alongside your delivery and pickup tickets, shows whether your in-person experience is pulling its weight or whether you are quietly becoming a fulfillment window. That is a strategic question worth watching in 2026.
A simple playbook to defend your traffic
You do not need a data team to act on this. You need an accurate count and a habit of checking it. Here is a practical sequence.
- Establish your baseline. Track entries for a few weeks before changing anything. Learn your real average day, your true peaks, and (once your POS is connected) your current conversion rate. Most operators are surprised: the hour they assumed was busiest often is not.
- Map the curve, then schedule to it. Plot traffic hour by hour across several weeks and build the schedule backward from your peaks. Move hours, do not add them.
- Watch conversion, not just covers. When traffic holds steady but conversion dips in a specific window, that is usually a service or seating bottleneck you can fix.
- Test one change at a time. Adjust a shift, a greeter, or a promo, then compare traffic and conversion for two to three weeks. Keep what works.
- Compare locations. If you run more than one venue, your highest-sales spot may not be your most efficient one. Conversion reveals which site just needs a staffing tweak to catch up.
If you want the fundamentals first, our complete guide to foot traffic analytics walks through how to read these patterns from scratch, and it translates directly to hospitality venues.
How people counting fits a restaurant or a bar
The whole playbook depends on one thing: an accurate, hour-by-hour count of who actually walks in. Manual clicker counts are inconsistent and fall apart the moment your host gets busy. Cameras raise privacy questions and usually need wiring and IT. And your POS, as noted, only sees the guests who already paid.
This is the gap a dedicated people counter fills. Dor is a peel-and-stick thermal sensor that installs in minutes with no wires, no Wi-Fi dependency, and no IT involvement. It counts visitors with camera-level accuracy while capturing zero personal data, using anonymous thermal sensing rather than cameras, so there is nothing to slow down deployment in a busy venue. Connect your POS and you can see traffic and conversion by hour across every location on one dashboard. It is already deployed in more than 2,000 locations, and the battery lasts over two years.
The reason this matters so much right now is leverage. As Dor's own retail data puts it, a 1% increase in conversion rate can translate into roughly a 10% increase in revenue. When category traffic is falling, you cannot always make more people walk by. You can make sure far more of the ones who do walk in become seated, served, and satisfied. That is a lever you own.
The bottom line
The 2026 numbers are a nudge, not a verdict. Fast food traffic is down, dine-in is holding, and the brands winning are the ones paying attention to the guest experience rather than hoping price alone carries them. You cannot control fuel prices or the macro economy. You can control whether you know what is happening at your own front door, and whether you turn passing traffic into paying guests.
Stop guessing about your busiest hours and your true conversion rate. If you want to see what your venue's real traffic curve looks like, book a quick demo or see pricing and get started. The sooner you can see your door, the sooner you can defend it.
Sources
- Julie Littman, "QSR traffic fell 4.4% in May," Restaurant Dive, July 6, 2026 (Placer.ai data): restaurantdive.com
- "Why Chipotle and McDonald's Took Different Paths in Q2 2026," Placer.ai: placer.ai
- Dor Technologies, Retail People Counting (conversion and revenue figures): getdor.com/industries/retail