Foot traffic is soft, and it is not bouncing back this quarter. Circana reported that overall U.S. retail sales revenue slipped 1% year over year in July, with unit sales down 2%, and discretionary general merchandise fell harder: dollar sales down 4.3% and unit demand down 3.9% for the four weeks ending August 1. Spending is holding up mostly among higher-income shoppers, which means the pool of people willing to walk into your store and open their wallet is smaller and pickier than it was a year ago.
When traffic tightens like this, the reflex is to chase more of it: another ad, another promotion, another push to get bodies past the door. But there is a cheaper lever sitting right in front of you, and most stores never touch it. It is called capture rate, and it measures how good your storefront is at turning the people who walk past your store into people who walk in.
What is retail capture rate?
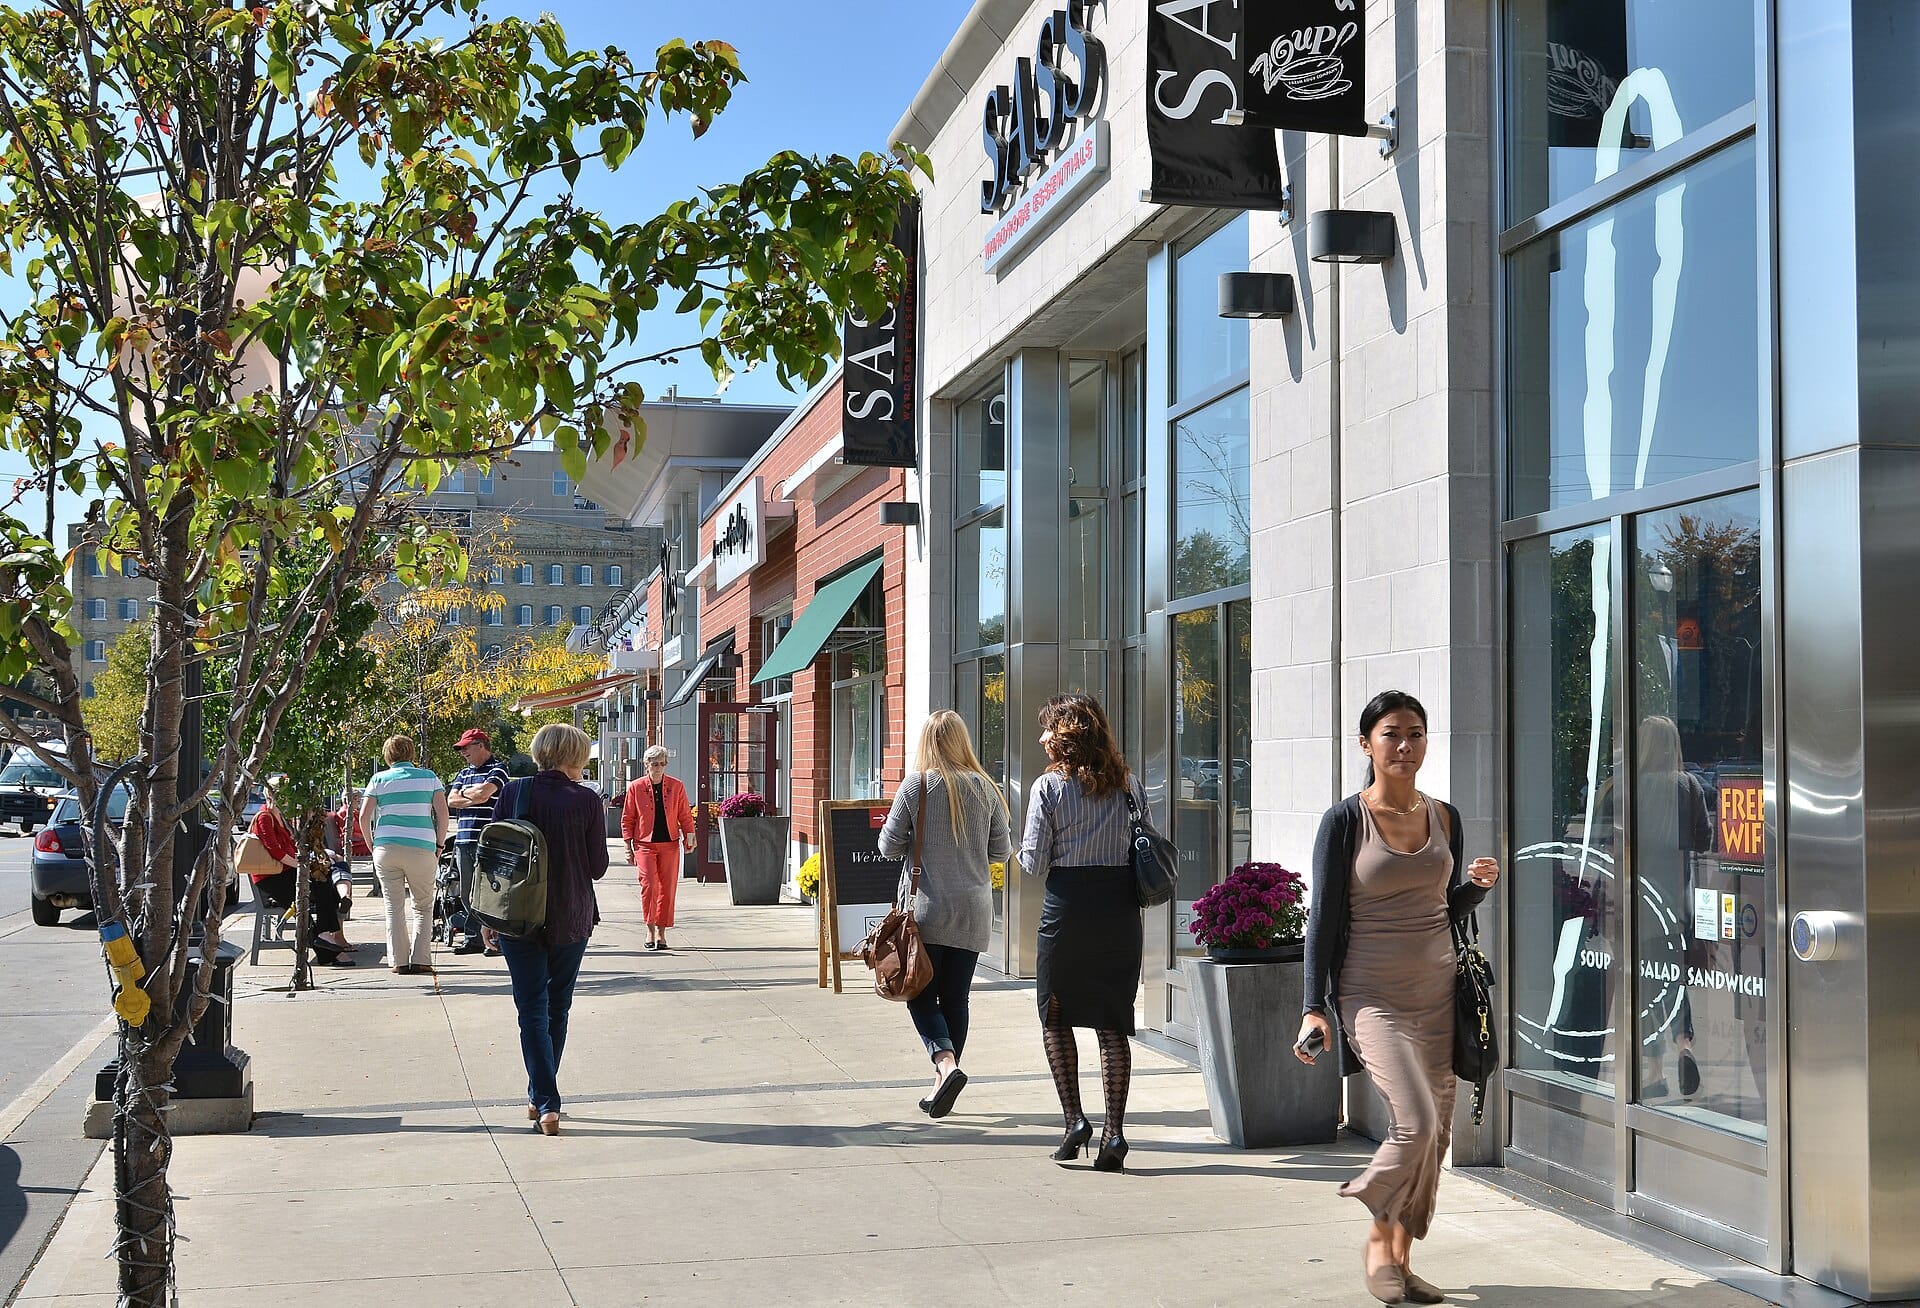
Capture rate is the share of passersby who actually enter your store. If 1,000 people walk past your entrance in an hour and 80 of them come inside, your capture rate is 8%.
The formula is simple:
Capture rate = (people who entered ÷ people who passed by) × 100
That is it. The math is easy. The reason capture rate stays a blind spot for most retailers is the denominator. Nearly every store can count entries. Almost none count the pass-by traffic on the sidewalk in front of them. So they end up staring at a raw entry number that tells them how many people came in, but never tells them how many they missed.
Here is why that gap matters. Your entry count can rise simply because more people happened to walk by, with your window, signage, and offer doing none of the work. It can also fall on a day when the sidewalk was quiet, even though your storefront was pulling in a healthy slice of everyone who passed. Without the denominator, you cannot tell a merchandising win from a foot-traffic fluke.
Why capture rate matters more in a soft market
In a boom, weak capture rate hides. Enough people flow past that even a mediocre storefront fills up. In a downturn, there is no cushion. Every passerby you fail to convert into a visitor is a sale that walks to the store next door.
The 2026 backdrop makes this concrete. Back-to-school spending is shaping up to be, in Circana's words, "moderate at best," with growth driven by higher prices rather than more units sold. The National Retail Federation still projects record back-to-school outlays of $43.3 billion, up from $39.4 billion in 2025, but that money is concentrated in fewer, more deliberate trips. Shoppers are planning purchases with intent, comparing before they commit, and skipping the browsing laps they used to take.
That behavior rewards stores that earn the entry. A shopper who is only going to make three retail stops this week instead of six is a shopper you have to pull off the sidewalk on purpose. Capture rate is the metric that tells you whether you are doing it.
Capture rate vs conversion rate vs foot traffic
These three numbers get lumped together, but they answer completely different questions, and you need all three to see the whole funnel.
- Foot traffic counts how many people passed by or entered. It measures exposure, not effectiveness.
- Capture rate measures how many passersby you pulled inside. It grades your storefront, window, and offer.
- Conversion rate measures how many visitors bought once they were in. It grades what happens on the sales floor.
Read in sequence, they localize a problem instead of leaving you guessing. A falling capture rate points at your frontage: the window, the signage, the visibility from the street. A steady capture rate with falling conversion points inside: layout, product mix, staffing, wait times. This is the same logic behind why conversion rate matters more than raw foot traffic, extended one step further up the funnel.
Here is the trap. Optimize conversion in isolation and you can post a better conversion rate on a shrinking, self-selected trickle of visitors while total sales fall. The conversion percentage looks great. The store is dying. Capture rate is what exposes that illusion, because it shows you whether the top of your funnel is filling or draining.
What a good capture rate looks like
There is no universal target, and you should be skeptical of anyone who quotes you one. Capture rate reflects three things at once: the pull of your offer, the strength of your brand, and the competition around you. A destination flagship on a packed high street will often post a lower capture rate than a convenience format on a quiet block, simply because the flagship's sidewalk is full of people who were never going to be its customers.
So the only benchmark that means anything is your own trend and your own comparable locations. If five similar stores in your network cluster around one figure and one branch sits two points below it, that gap is the opportunity. A capture rate that holds steady or climbs is a healthy signal. A slow decline is an early warning that shows up weeks before it reaches your sales report.
It helps to remember how much of the buying decision happens at and just past the glass. Research on shopper behavior has long found that the majority of purchase decisions are made in the store rather than before arrival, and that most shoppers do not fully plan their baskets before they enter. Studies of clothing retailers specifically show that window displays influence the decision to walk in at all. The storefront is not decoration. It is the first and cheapest conversion tool you own.
How to raise your capture rate
Once you can see the number, moving it is mostly about the first ten feet of your store. A few of the highest-leverage places to start:
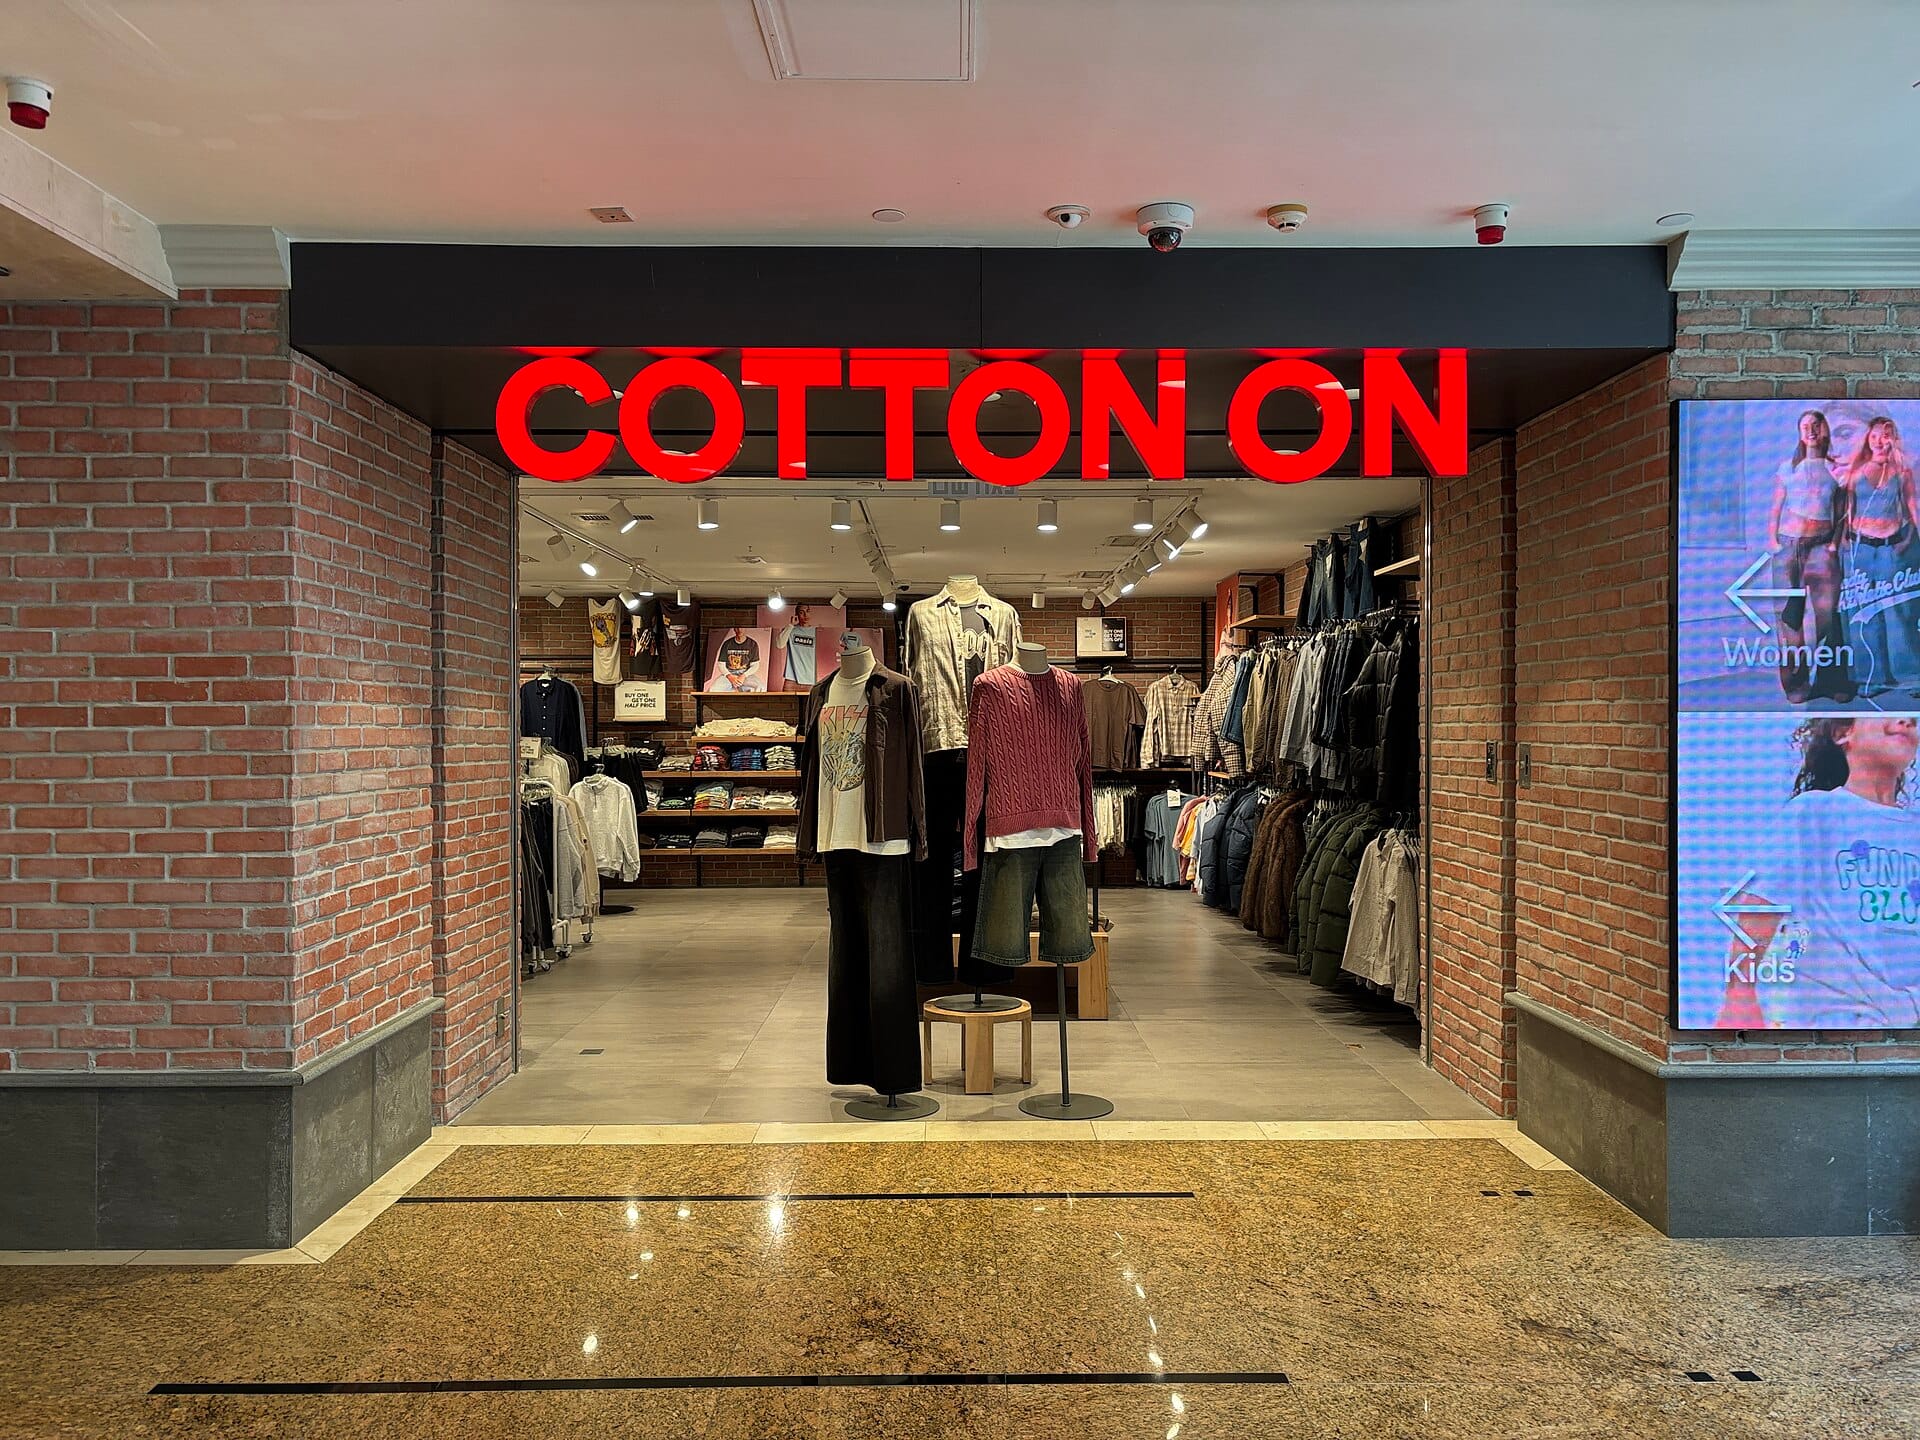
- Put your strongest pull in the sightline from the street. Move your best-selling or most eye-catching category into the window and the front zone, not the back wall. The average passerby gives your window a glance measured in seconds, so lead with what stops them.
- Refresh the window on a schedule, not a whim. Tie changeovers to the days your pass-by traffic peaks. A stale window is invisible to regulars who walk by daily.
- Cut friction at the threshold. A propped-open door, a clear entrance, and legible signage all lift entries. Anything that makes a store look closed, cramped, or confusing costs you captures.
- Make the offer readable in one pass. If there is a promotion, a passerby should grasp it without stopping. Clarity beats cleverness on the sidewalk.
- Staff the door during pass-by peaks. A visible, welcoming presence near the entrance converts hesitation into entry, especially for higher-intent shoppers who are choosing where to spend a limited trip.
- Test and measure like-for-like. Weather, holidays, and events move both entries and pass-by. Compare the same time windows, not raw days, so you can tell a real storefront win from a busy afternoon.
How people-counting data makes capture rate real
Capture rate is only as trustworthy as the two counts behind it, so accuracy is everything.
The entries side is the easy part. An accurate, always-on door counter records every visit, in and out, and de-duplicates the shopper who steps out for a phone call and comes back. This is exactly what a thermal people counter like Dor does: it registers each person passing through the doorway using anonymous heat signatures, with no cameras and no personal data, and syncs the count to a dashboard automatically. Because it is battery-powered and peel-and-stick, it installs in minutes on any entrance without wiring or an IT ticket, and it connects to your POS so your conversion rate is calculated for you. That gives you a clean, reliable numerator you can stand behind.
The pass-by side is the piece most stores are missing, and it is exactly where Dor closes the gap. Alongside the entrance counter, Dor can provide a second, outward-facing sensor aimed at your storefront that counts the people walking past. That gives you the denominator most retailers never have. Pair the two and both numbers land on the same dashboard over the same time windows: the entrance sensor tells you how many people came in, the pass-by sensor tells you how many you had the chance to convert, and your capture rate is calculated for you automatically. Like the entrance unit, the pass-by sensor is anonymous thermal counting with no cameras and no personal data, so there is nothing extra to configure for privacy.
Start with an accurate entry count and your conversion rate to get the bottom of your funnel airtight, then add the pass-by sensor to close the loop and turn capture rate into a live operating metric. The point is to stop flying blind on the one number that grades your storefront.
This is the same discipline behind good foot traffic analytics generally: count reliably, pair the count with sales, and use the result to make decisions you were previously making on gut feel. Capture rate simply extends that logic to the sidewalk.
The bottom line
When traffic is plentiful, a weak storefront survives on volume. In 2026, with fewer, more deliberate shoppers and spending concentrated at the top, volume is not coming to the rescue. The stores that grow will be the ones that squeeze more visits out of the traffic they already have, and that starts with measuring how many passersby they capture and treating the first ten feet of the store as the conversion tool it is.
You cannot improve what you cannot see. Get your entry count accurate, connect it to your sales, and the whole funnel opens up in front of you.
Want to see what your store's real numbers look like? Book a demo or check pricing to start counting in minutes, no IT required.
Sources
- Retail Dive, "Back-to-school spending could be 'moderate at best'" (Circana data), August 17, 2026
- Retail Dive, "Back-to-school spending forecast to hit record high" (NRF and Prosper Insights & Analytics)
- Journal of Retailing and Consumer Services, "How do storefront window displays influence entering decisions of clothing stores?"