The parking lot is fuller this year. If you run a store in a shopping center, you've probably felt it: more cars, more strollers, more bags. And the data backs up the feeling, American shopping centers are having a genuinely good year.
But here's the uncomfortable question every tenant should be asking: is that rising tide actually lifting your store, or just floating past your door?
Because "the mall is busy" and "my store is busy" are two very different statements. And if you can't tell them apart, you're flying blind during the best shopping center foot traffic environment retail has seen in years.

The 2026 shopping-center comeback, in numbers
Shopping-center foot traffic is up across the board. According to Placer.ai's June 2026 Mall Index, all three mall formats posted year-over-year visit growth in the first half of 2026:
- Open-air shopping centers led the pack, with visits up 4.7%
- Indoor malls rose 1.9%
- Outlet malls grew 1.0%
The momentum carried into the summer. In June alone, open-air center visits were up 5.1% year over year, indoor malls gained 1.2%, and outlet malls added 1.0%, the third straight month of growth across all three formats.
What's driving it matters as much as the headline number. Placer.ai found the gains are coming from a broader, more diverse mix of shoppers, not just higher-income households, suggesting malls are widening their appeal even as consumers stay selective about discretionary spending. The blend of retail, dining, and entertainment is pulling more kinds of people through the doors.
For retailers, that's the good news: more feet, more variety, more chances. The catch is that all of this data describes the center, the property, the whole parcel of stores. None of it tells you what's happening at your particular storefront.
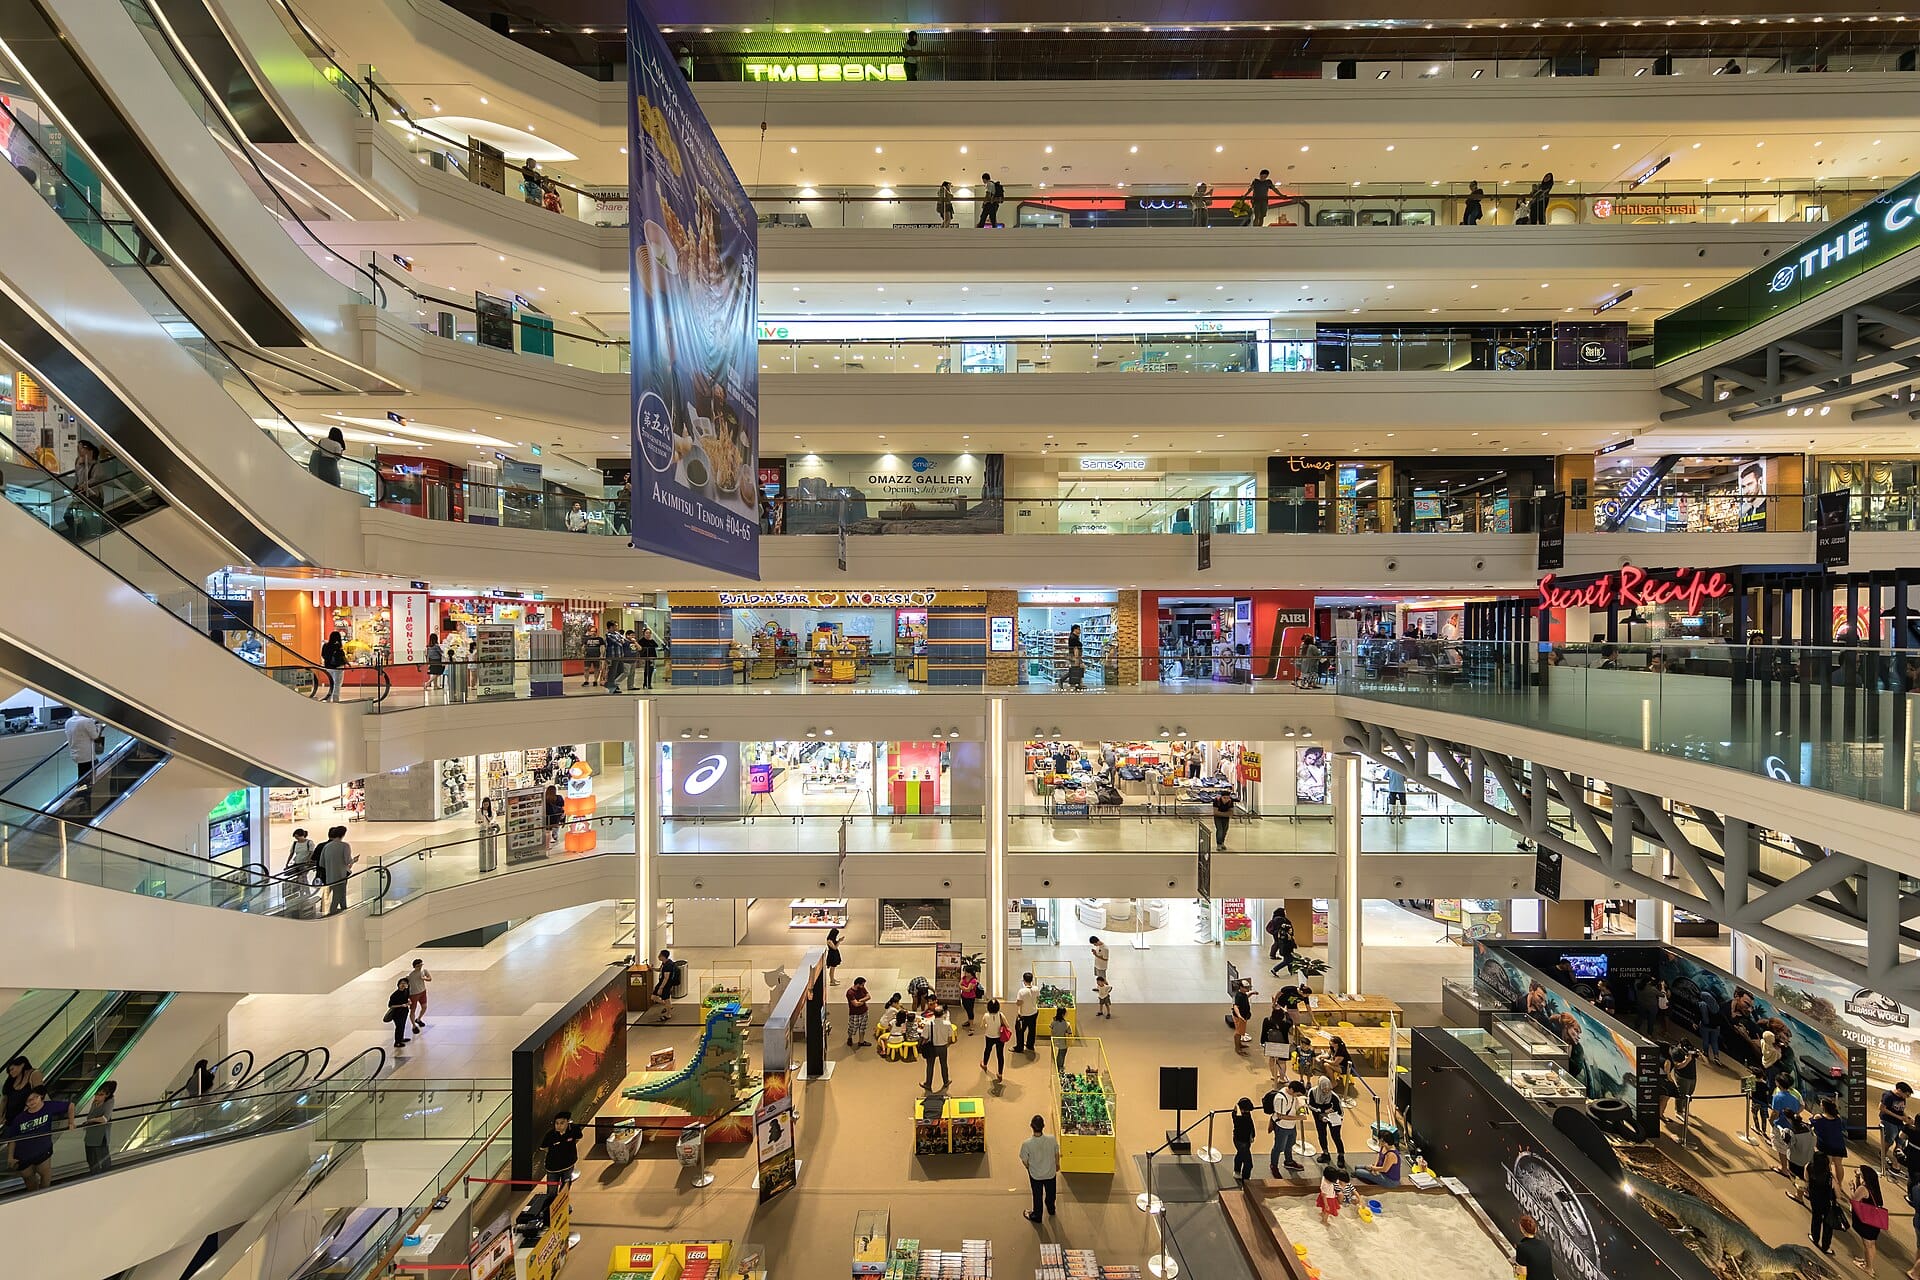
Why "the mall is busy" doesn't mean "your store is busy"
Market-level traffic data, the kind that powers reports like the Mall Index, is measured at the property or trade-area level. It's fantastic for landlords, site-selection teams, and investors who want to know whether a location is trending up.
But a single tenant lives or dies on a much narrower number: how many of those center visitors actually walk through your door. That's your capture rate, and it can move in the complete opposite direction of overall mall traffic.
Picture an open-air center with visits up 5%. Down at the anchor end, a well-placed store with a compelling window might be capturing a bigger slice of that bump. Meanwhile, a store tucked past the food court with a tired entrance display could see its own door count flat or falling, even as the property celebrates a record month. Same parking lot, opposite outcomes.
This is the trap of borrowed data. When you read that mall traffic is up and assume you're sharing in it, you stop asking the questions that actually determine your results:
- Are more people walking into my store, or just past it?
- Of the ones who come in, how many are buying?
- When exactly is my store busiest now that the traffic pattern has shifted?
You can't answer any of those with a market report. You can only answer them by counting your own traffic.
The three numbers that turn center traffic into your sales
If shopping-center visits are climbing, here are the three store-level metrics that decide whether that trend shows up in your P&L.
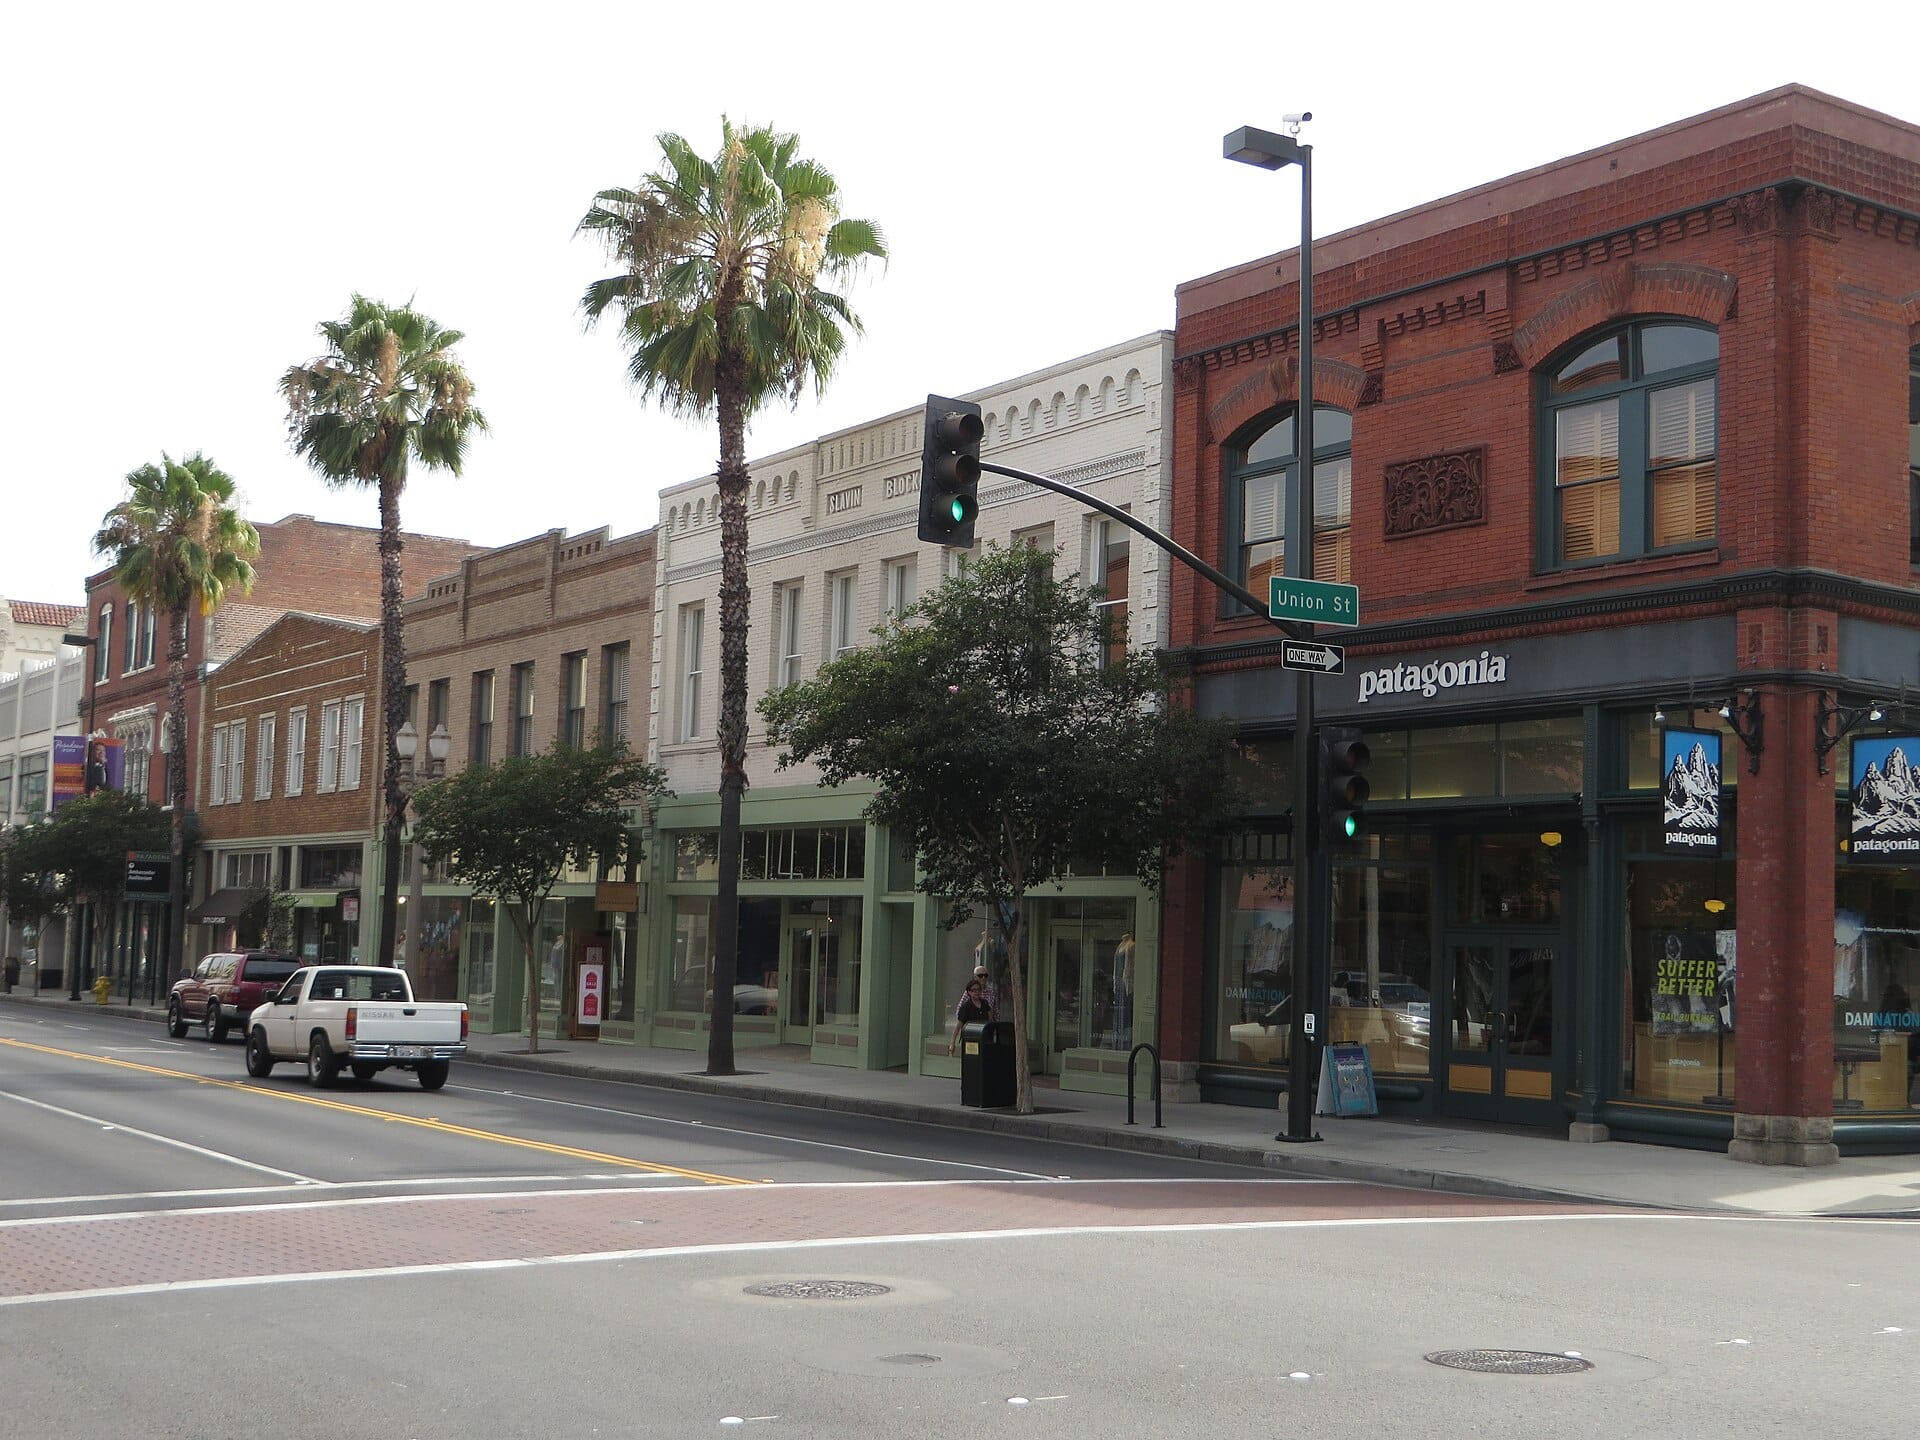
1. Capture rate: are you catching the wave?
Capture rate is the percentage of nearby shoppers, mall visitors, passersby, people on your block, who actually enter your store. When center traffic rises, your capture rate tells you whether you're grabbing your fair share of it. A rising center with a flat door count is a flashing warning light: the demand is there, and it's walking past you.
Improving capture rate is often the fastest win in retail, because it's driven by things you control at the threshold, windows, signage, entrance layout, and lighting. But you can't improve what you don't measure, and capture rate is invisible without a reliable count of who's coming in.
2. Conversion rate: are visitors becoming buyers?
Conversion rate, the share of visitors who make a purchase, is the metric that most directly connects traffic to revenue. In a strong traffic year, conversion is where the money is either captured or quietly lost. If 400 people came in on Saturday and 80 bought something, that's a 20% conversion rate. Nudge it to 24% and you've added revenue without spending a dollar more on marketing.
The danger during a traffic upswing is complacency. More visitors can mask a soft conversion rate, sales are up, so everything feels fine, while you're leaving serious money on the table with understaffed floors or slow checkouts.
3. Traffic timing: have your peaks moved?
A broader mix of shoppers means your busy periods may have shifted. The families and younger shoppers Placer.ai flagged don't necessarily shop at the same hours as your old core customer. If your staffing schedule is built on last year's rhythm, you may be overstaffed on a quiet Tuesday morning and dangerously thin on a newly busy Thursday evening.
Knowing your current traffic curve, by hour and by day, is the difference between scheduling to reality and scheduling to a memory.
What rising center traffic should change about how you operate
A strong traffic environment is a gift, but only if you act on it. Four practical moves:
- Merchandise for the threshold, not just the shelf. When more people are passing by, your window and entrance are doing more work than ever. Treat them as conversion tools. Refresh displays on the days center traffic peaks, and make the first ten feet inside the door impossible to walk past.
- Staff to your real peaks. Pull your traffic data for the last several weeks and schedule your strongest associates for the hours you're actually busiest now, not the hours you assume. Peak-hour coverage is one of the highest-leverage decisions a store manager makes.
- Measure every promotion by the door, not just the register. When you run a sale or a weekend event, watch whether foot traffic actually rises. If sales go up but traffic is flat, your existing customers just spent more, useful to know, but a different play than attracting new visitors.
- Benchmark location by location. If you run multiple stores, rising center traffic won't lift them equally. Comparing capture and conversion across locations shows you which stores are riding the wave and which need attention.
How people-counting data closes the gap
Every one of those moves depends on one capability: accurately counting the people who enter your store, in real time, all the time.
Market data tells you the neighborhood is busy. A people counter tells you what's happening at your own front door, the number the market report can never give you. Pair that door count with your point-of-sale data and you get the two metrics that matter most: capture rate (are you catching the traffic?) and conversion rate (are you closing it?).
Modern people-counting sensors have made this simple. Instead of a clicker at the door or an employee guessing, a small sensor at the entrance counts every visitor automatically, feeds the data to a dashboard, and lets you see your traffic by hour, day, and location. Layered on top of a strong traffic year, that visibility is the difference between hoping you're benefiting from the mall rebound and knowing it.
Where Dor comes in
This is exactly the gap Dor was built to close. Dor's thermal sensor counts everyone who enters your store automatically, no clicker, no staff pulled away from customers, no wiring or IT project. It's battery-powered, installs in minutes, and starts delivering data the same day.
From there, Dor turns your door count into decisions: it shows your traffic patterns by hour and day, connects to your point-of-sale system to reveal your conversion rate, and lets you compare performance across locations. So when you read that shopping-center traffic is up 5%, you won't have to wonder whether you're sharing in it. You'll know your capture rate, your conversion rate, and exactly where to act.
The 2026 traffic rebound is real, and it's still building heading into the second half of the year. The retailers who turn it into revenue won't be the ones with the busiest parking lots. They'll be the ones who can see their own front door, and manage it.
Want to know whether the mall rebound is actually reaching your store? Book a Dor demo and start counting what matters.
Sources
- Placer.ai, "June 2026 Mall Index: Momentum Heading Into H2 2026", placer.ai
- Chain Store Age, "Placer.ai: Mall traffic grows with one format in the lead" (July 10, 2026), chainstoreage.com