Your busiest day used to be predictable. Saturday brought the crowds, the weekdays paid the bills, and the shape of your week barely moved from one month to the next. That shape is changing, and the reason is happening a few blocks away in office towers, not in your store.
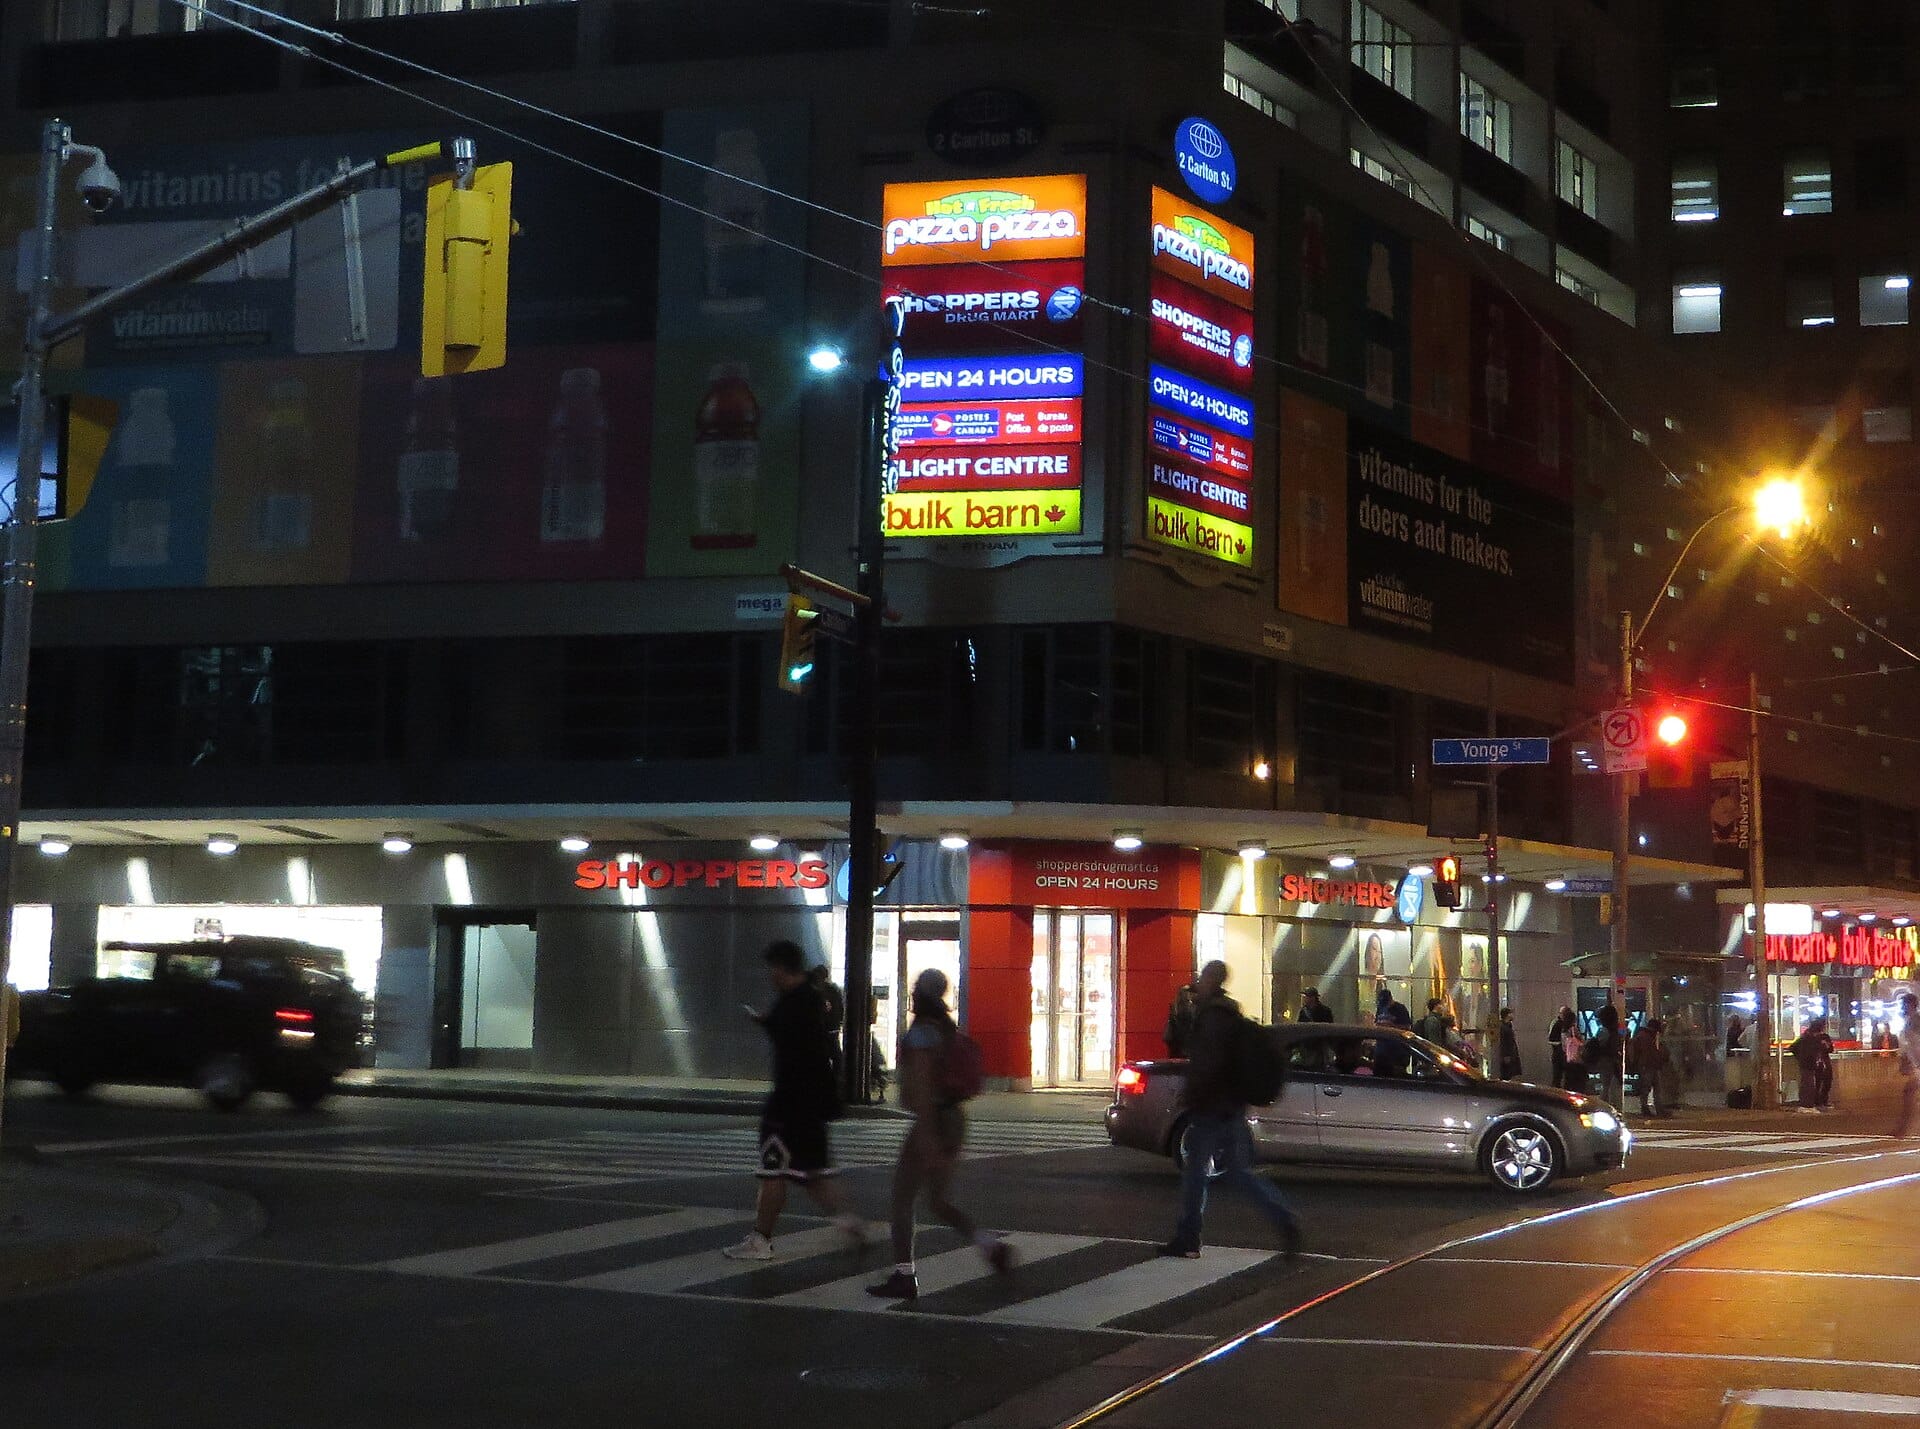
Return-to-office mandates are pulling workers back downtown, but not evenly and not on the old schedule. The result is a weekday foot traffic pattern that looks nothing like 2019, and if your staffing and hours are still built on muscle memory, you are almost certainly covering the wrong hours. Here is what the latest data shows, why it matters for your store, and how to adjust before the mismatch costs you sales.

The weekday is where the traffic gap lives
Weekend shopping bounced back years ago. The weekday did not. According to Placer.ai, foot traffic to downtown retail corridors from Monday through Thursday ran 16.3% to 17.3% below 2019 levels in 2025. That gap narrowed to 11.7% on Friday and nearly disappeared on weekends.
Read that again, because it is the whole story in one sentence. The hole in retail traffic is concentrated on weekdays, and it lines up almost perfectly with how many people are commuting to an office.
It gets more specific. The steepest declines land inside traditional working hours. Placer.ai found that downtown visits between 7 AM and 11 AM were down 23.7% compared to 2019. Those are the pre-work coffee runs, the mid-morning errands, and the "grab it on my way in" purchases that used to be automatic. Fewer commuters means fewer of those trips, and the morning is where it shows up first.
Return-to-office is closing the gap, unevenly
The pressure is now running the other way. Office attendance is climbing. Placer.ai reported that March 2026 was the busiest March for office visits since the pandemic began, with traffic just 26.5% below 2019. November 2025 was the strongest November for office occupancy since 2019, driven by stricter return-to-office mandates and a settling "new normal."
When those workers come back, nearby retail feels it fast. In Seattle, after Amazon moved to a five-day in-office policy in January 2025 for roughly 50,000 downtown workers, foot traffic in the Amazon-heavy Denny Regrade and South Lake Union neighborhoods jumped 22% versus the prior December and 36% over January 2024, according to reporting compiled by the Washington Retail Association. By that summer, downtown Seattle averaged more than 90,000 workers per weekday, a 14% year-over-year increase.
The catch is that the rebound is not uniform. Downtown Denver hit a 74% weekday return-to-office rate in March 2026 with pedestrian activity at 84% of March 2019, one of the strongest recoveries in the country. San Francisco set records for office demand but still sees weekday foot traffic well under half of pre-pandemic levels. Two downtowns, two completely different weekday curves.
The lesson for operators is simple: national headlines will not tell you what is happening on your block. The recovery is local, it is hour-specific, and the only way to know your version of it is to measure your own door.
Why this quietly breaks your schedule
Most store schedules are built by habit. The same headcount opens, the same crew closes, and the weekly shape rarely changes. That was survivable when traffic was stable. It is expensive now that the weekday curve is moving underneath you.
Consider what a shifting weekday does to your floor:
- The morning is thinner than it feels. If your 7 to 11 AM window has lost a chunk of its old commuter traffic, a full opening crew is paying for hours that are not there anymore.
- The midday peak may be moving. As office workers return, lunch-hour and after-work windows can rebuild quickly in some corridors, creating a new peak your schedule never accounted for.
- Tuesday is not Thursday. Hybrid schedules cluster office attendance midweek, so Tuesday through Thursday often runs hotter than Monday or Friday. A flat weekly schedule over-covers the slow days and starves the busy ones.
This matters because labor is most retailers' largest controllable expense, and the margin for waste is shrinking. In the British Retail Consortium's 2026 survey, 61% of retailers said they plan to reduce staff hours or overtime and 45% expect to freeze recruitment in response to rising labor costs. You are being asked to do more with fewer hours, which makes putting those hours in the right place the entire game.
The cost of guessing
When your coverage does not match your traffic, you lose money in two directions at once. Overstaffed slow hours burn payroll you cannot get back. Understaffed peaks cost you sales, because shoppers who wait too long for help simply leave.
That second cost is the one retailers underestimate. Roughly 70% of shoppers leave a store without buying anything, and in-store conversion sits between 20% and 45% for most sectors. The people walking out are not a rounding error, they are your biggest pool of recoverable revenue. When a thin floor during a rebuilt lunch peak drops your conversion even a few points, the damage is real. Industry operators peg a 10-point conversion drop at roughly $5,000 to $7,000 in lost sales per location, per month.
Here is the uncomfortable part: most stores cannot see it happen. Your POS only records the people who bought. It says nothing about the shoppers who walked in, waited, and left. Without a count of who actually came through the door, a return-to-office traffic shift is invisible until it shows up as a soft month you cannot explain.
How foot-traffic data turns the shift into an advantage
You cannot control whether the office tower down the street brings workers back on Monday or clusters them on Wednesday. You can control whether you see it and respond. That is exactly what hour-by-hour people-counting data is for.
1. Map your real weekday curve
Pull at least four weeks of foot traffic and look at the shape of an average day, hour by hour, for each day of the week separately. Four weeks smooths out one-off spikes and shows the pattern you can actually schedule against. Watch specifically for a morning that has gone quiet and a midday or late-afternoon window that is rebuilding as workers return.
2. Schedule backward from the new peaks
Once you know the curve, staff to it instead of to the clock. Bring one or two people in at open, then layer the rest of the team in about an hour ahead of your real peak so the floor is covered before the rush, not scrambling once it starts. The goal is not to add hours. It is to move them off the hollow morning and onto the window that now converts.
3. Rebalance by day of week
If midweek is running 20% to 40% hotter than Monday and Friday, move hours into it. Shifting hours from your slowest days to your busiest ones is one of the fastest wins available, because it does not touch your total labor budget at all. Retailers that schedule against real foot traffic have cut labor costs by 8% to 15% while lifting conversion 5% to 12%.
4. Watch conversion, not just headcount
Counting bodies is half the picture. The question that matters is whether those visits become sales. When you put traffic and conversion side by side, an understaffed hour is obvious: traffic holds steady but conversion sags, usually because there were not enough associates to help everyone. Those are the exact hours a return-to-office rebound will create, and the exact hours worth defending.
Where Dor fits
All of this depends on one thing: an accurate, hour-by-hour count of who walks through your door, matched against what they bought. That is the gap Dor was built to fill.
Dor is a peel-and-stick thermal sensor that installs in minutes with no wires, no Wi-Fi, and no IT involvement. It counts visitors with camera-level accuracy while capturing zero personal data, and the battery lasts more than two years. Connect your POS and you can see traffic and conversion by hour, day, and location on a single dashboard, which is precisely the view you need to read a shifting weekday. More than 2,000 stores already use it to schedule with confidence, and roughly 91% of clothing retailers still do not know their conversion rate, so simply having the number puts you ahead.
You do not need to predict the return-to-office curve. You need to see yours, week over week, and keep pointing your hours at the moments that earn them.
The takeaway
Return-to-office is not a single event, it is a slow, uneven rewrite of the retail week. The weekday gap that opened after 2019 is closing in some corridors and lingering in others, and the shift is landing hour by hour inside your store whether you track it or not. Retailers who still schedule by habit are covering a week that no longer exists. Retailers who read their own traffic curve, staff backward from the real peaks, and defend the hours where conversion lives will turn a confusing macro trend into a quiet, repeatable edge.
Map your curve. Move your hours. Measure the result. The office towers will keep changing their minds about the workweek. Your schedule does not have to guess.
Want to see what your store's real weekday curve looks like? Book a demo or see Dor pricing and start turning foot traffic into better decisions this week.
Sources
- Placer.ai: Hybrid Work Has Reshaped Downtown Retail Traffic
- Commercial Property Executive: 2026 Placer.ai Office Index
- Washington Retail Association: Amazon's Return-to-Office Mandate Boosts Downtown Seattle Foot Traffic
- Downtown Denver Partnership: March 2026 High Frequency Update
- The Real Deal: Downtown SF Foot Traffic Still Sluggish Amid Return to Office
- TruRating: Retail Conversion Rate Analysis
- Traxsales: Retail Staffing Optimization, Schedule by Foot Traffic
- Dor: Retail People Counting