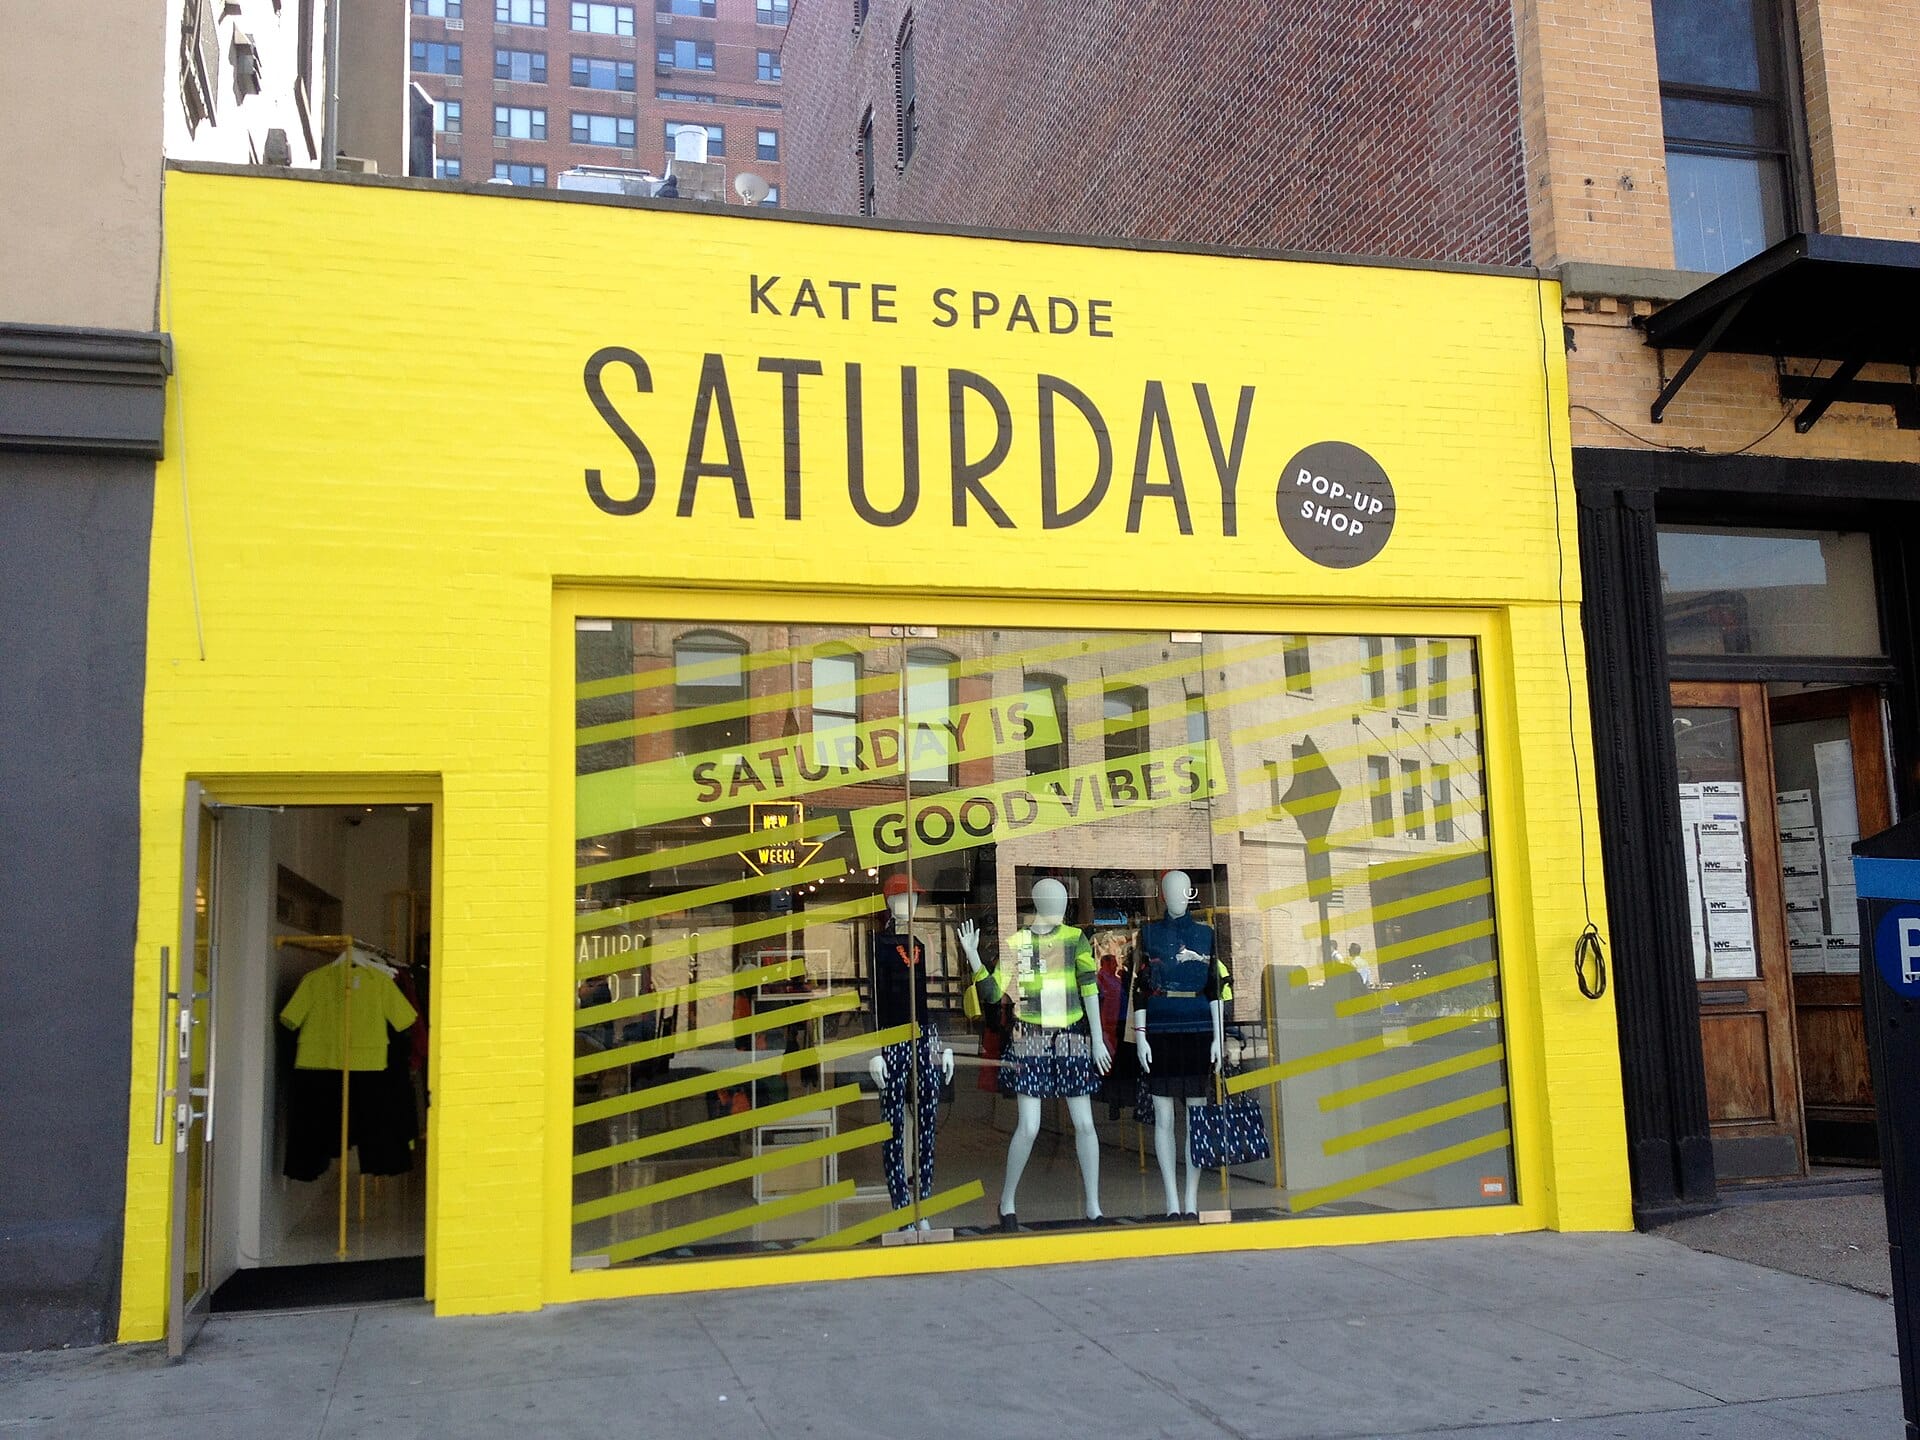
Pop-up shops are everywhere in 2026. A skincare brand takes over a corner storefront for a weekend. A DTC label tests a neighborhood before signing a lease. A national chain runs a holiday activation inside a mall it would never occupy year-round. The temporary store has gone from scrappy experiment to core retail strategy.
And the money follows. According to experiential marketing platform AnyRoad, 51% of brands planned to increase their experiential marketing investment from 2024 through 2026, with major brands often spending between $500,000 and $1 million on their annual experiential programs (as reported by Shopify). Pop-ups are a big slice of that spend.
Here is the problem: most brands pour real budget into these spaces and then measure them with a clicker at the door and a gut feeling at the end. If you cannot say precisely how many people came in, how many bought, and when your best hours actually were, you cannot prove the pop-up worked. And if you cannot prove it worked, you cannot get budget for the next one.
This is a measurement problem, and pop-up shop foot traffic is where it starts.
The pop-up boom is real, and it is expensive
Temporary retail is riding a broader in-store comeback. Physical shopping is having a genuinely good stretch: Placer.ai found overall U.S. retail visits climbed 0.4% year over year in 2024, and the momentum carried into 2026. Placer.ai's mid-2026 Mall Index showed all three center formats growing in the first half of the year, led by open-air centers up 4.7%. Coresight Research projected roughly 5% U.S. retail sales growth heading through the back half of summer 2026.
More feet in more places is exactly why brands keep launching pop-ups. A temporary space lets you meet that traffic where it already is: a busy open-air center, a festival, a high-street block, a seasonal window when demand spikes. You get discovery, buzz, and first-party customer data without a multi-year lease.
But "cheaper than a permanent store" is not the same as "cheap." Between build-out, staffing, product, and rent (which stays elevated in a tight retail real-estate market), a serious pop-up is a five- or six-figure bet. A bet that size deserves better than guesswork.
Most pop-ups measure the wrong thing
Here is the uncomfortable gap. AnyRoad found that 43% of brands running in-person events say loyalty is their main goal, yet the metrics they actually track are attendance (44%) and ticket or unit sales (46%). In other words, they say they want relationships, then they measure bodies.
Counting bodies is not useless. But raw attendance answers almost none of the questions that decide whether a pop-up was a good investment:
- Did the location actually deliver the traffic you were promised?
- Of the people who walked in, how many bought something?
- When were you busiest, and were you staffed for it?
- Did your Saturday event draw a crowd, or just the same trickle as Tuesday?
A headcount at the end of the day cannot answer any of those. To run a pop-up like a business instead of a party, you need a handful of specific numbers, measured continuously, from the moment the doors open.
The four numbers that prove a pop-up worked
You do not need a data science team. You need four metrics, and they build on each other.
1. Foot traffic: did the location deliver?
Start with the raw count of people who entered, by hour and by day. This is your baseline for everything else, and on its own it settles one of the biggest pop-up questions: was the location worth it? A landlord or event organizer promised you a certain volume of passersby. Accurate door counts tell you whether that promise held, and whether one day or time block carried the whole run. If you ever repeat the activation or scout a permanent site nearby, this is the data you will wish you had captured.
2. Capture rate: are you catching the crowd or watching it walk by?
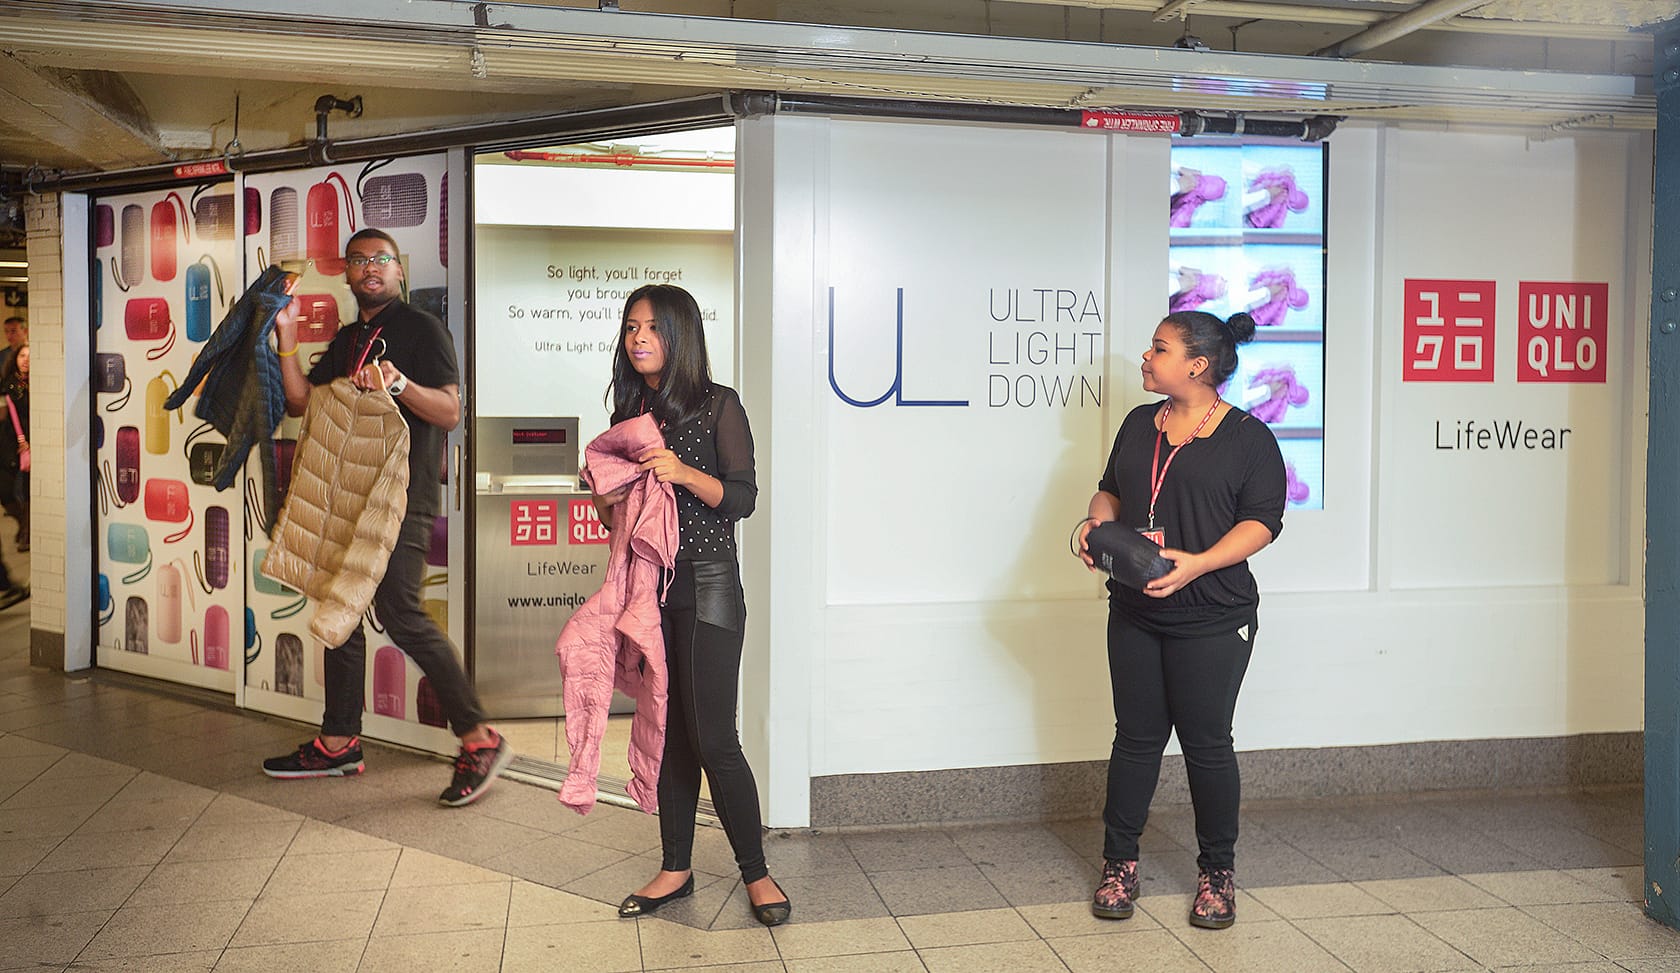
Capture rate is the share of nearby foot traffic that actually crosses your threshold. In a pop-up, this is often the single most controllable number, because it is driven by things you set up on day one: your window, your signage, your entrance, your street team. A busy block with a low capture rate is a flashing warning light. The demand is right there on the sidewalk, and it is walking past you. Small changes to the storefront can move this number fast, but only if you are measuring it.
3. Conversion rate: are visitors becoming buyers?
Conversion rate, the percentage of visitors who make a purchase, is the metric that connects traffic to revenue. Pair your door count with your point-of-sale data and the math gets honest in a hurry. If 300 people came in and 45 bought, that is a 15% conversion rate. Nudge it to 20% with better staffing or a cleaner layout and you have added revenue without spending another dollar to bring people in. During a busy pop-up weekend, conversion is where money is quietly captured or quietly lost. High traffic can mask a soft conversion rate right up until you count both.
4. Timing and dwell: when do you win?
Because a pop-up runs on a compressed clock, timing is everything. Hourly traffic data shows you your real peaks, which is often not when you assumed. That single insight reshapes how you schedule your (usually small) team, when you run demos or drops, and how long you should keep the doors open. Longer visits generally signal stronger engagement, so knowing when people linger versus when they cycle through tells you which hours and which moments in the run are actually working.
What good pop-up measurement looks like in practice
These numbers are not academic. They change decisions in real time.
Testing a new market. If your goal is to decide whether a neighborhood deserves a permanent store, capture rate and conversion at the pop-up are your cheapest possible market research. Strong door counts with weak conversion say the location draws the wrong crowd. Weak door counts with strong conversion say the demand is real but you need a better spot.
Launching a product. For a product drop, hourly traffic tells you whether your pre-launch marketing actually pulled people in on day one, or whether the crowd built by word of mouth over the weekend. That is the difference between "our campaign worked" and "our product sold itself," and you should know which.
Running a seasonal or holiday activation. Seasonal pop-ups live and die on a few peak days. Measuring traffic by hour lets you concentrate your best staff and your boldest offers exactly when the crowd shows up, instead of spreading a thin team evenly across quiet mornings and packed afternoons.
Comparing multiple activations. If you run pop-ups across several cities or several weekends, standardized traffic and conversion data lets you rank them fairly. You learn which formats, locations, and layouts to repeat, and which to retire, based on numbers instead of anecdotes.
Why people-counting data is the missing piece
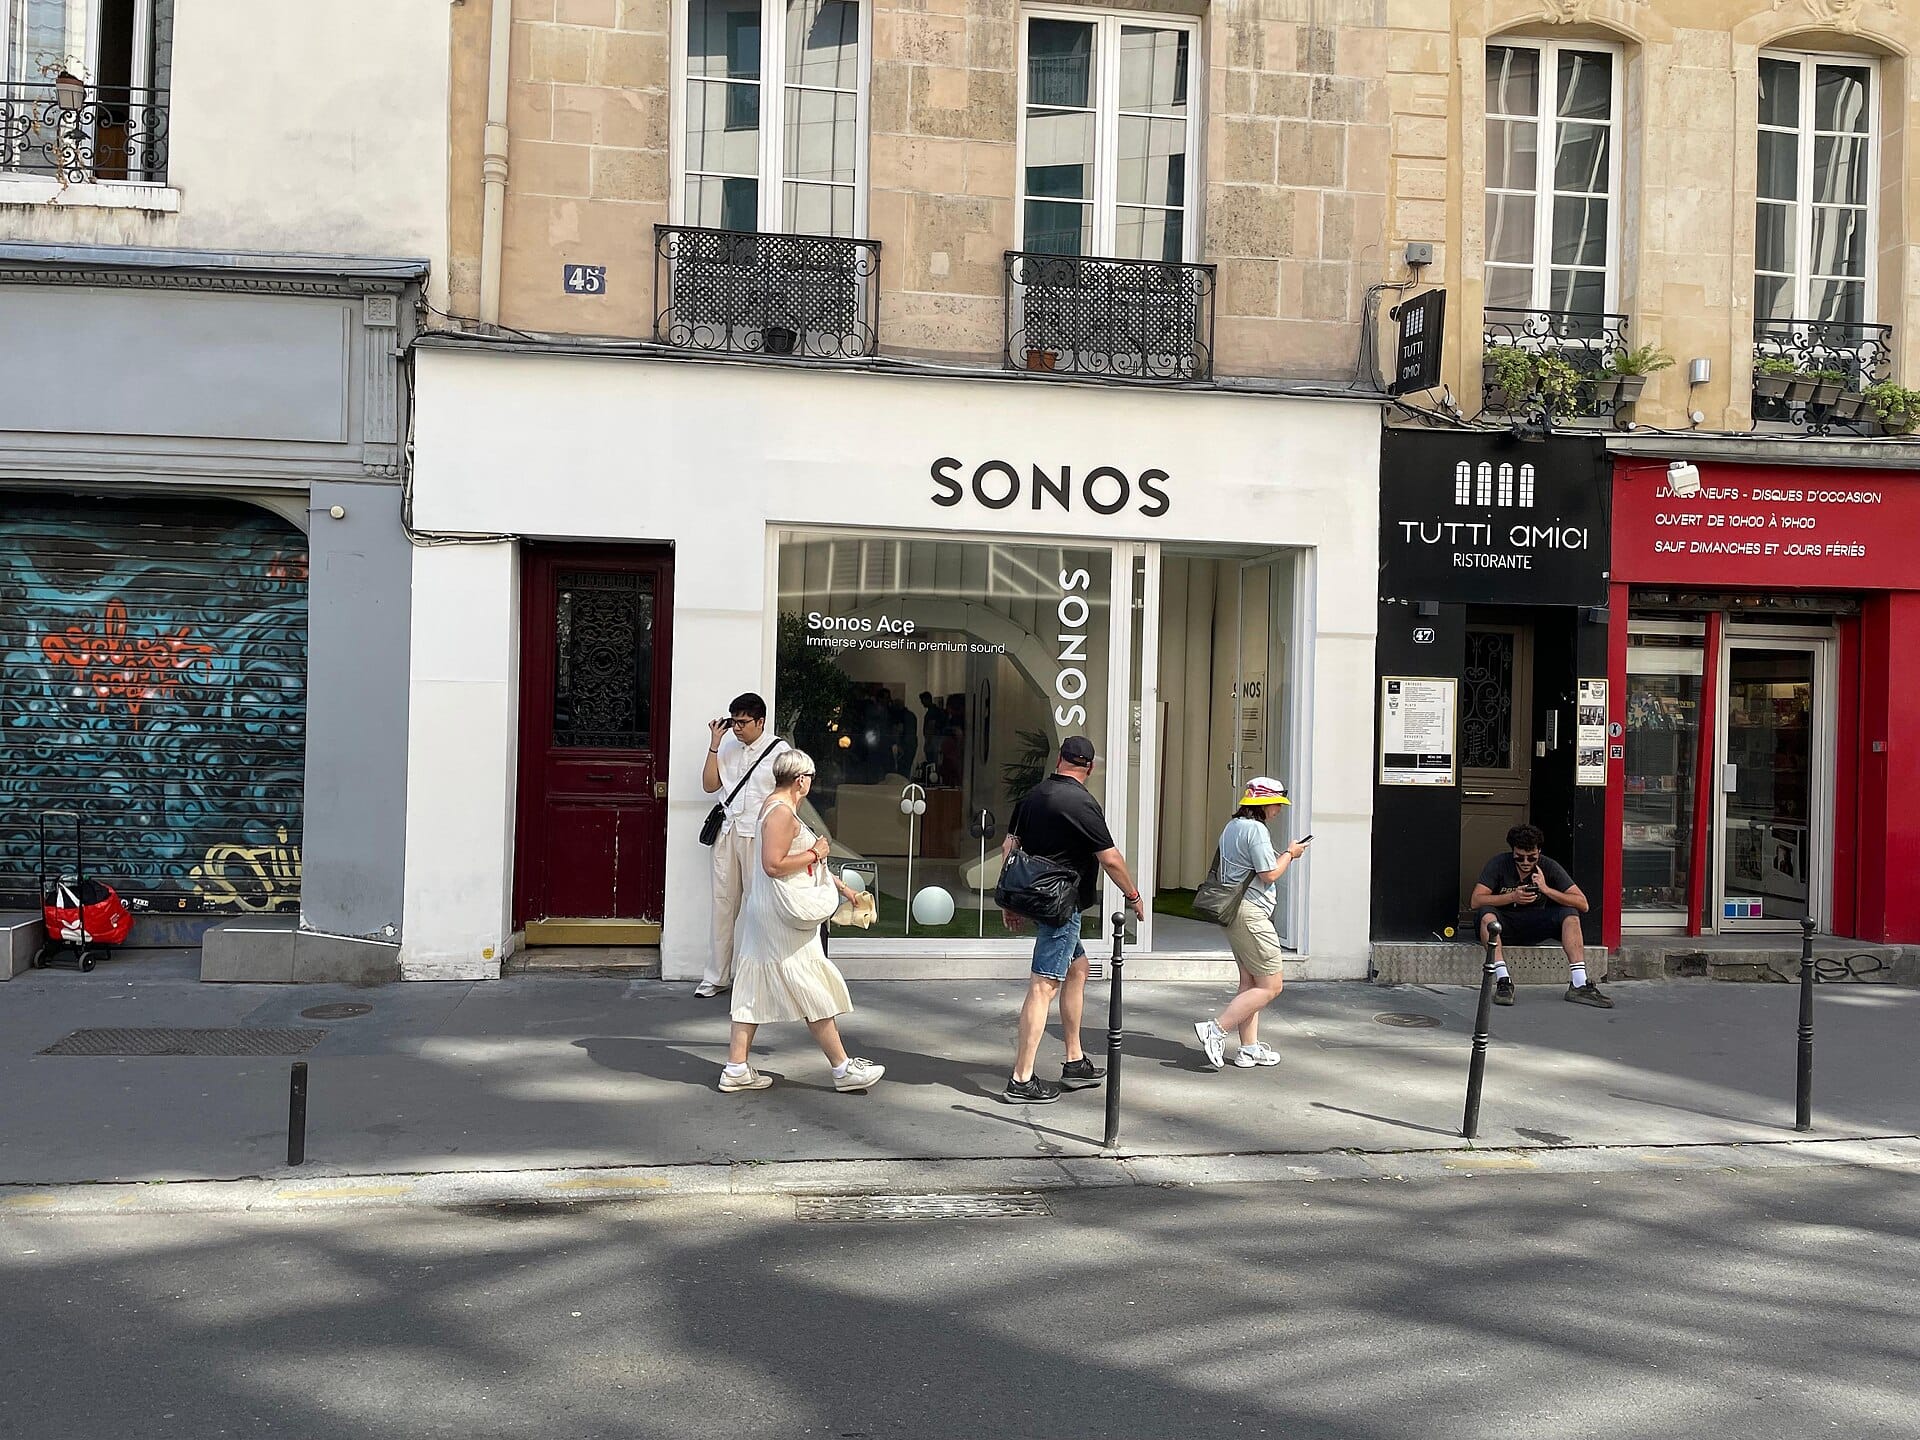
Every one of those moves depends on one capability: accurately counting the people who enter, in real time, for the entire run. Your point-of-sale system tells you about the people who bought. It says nothing about the far larger group who walked in, looked around, and left. That silent majority is where the story of a pop-up lives.
Manual counting does not scale in a pop-up. Your staff are busy selling, and a clicker forgotten for twenty minutes during a rush produces exactly the wrong data at exactly the wrong time. Camera-based systems raise privacy questions and usually need mounting, wiring, and setup time you do not have in a space that exists for a week. What temporary retail needs is a counter that is as portable and disposable as the store itself: something that shows up fast, installs without tools or IT, counts accurately, and travels to the next activation.
Where Dor fits
This is the gap Dor was built to close, and pop-ups happen to be an ideal match for how it works. Dor's thermal sensor is battery-powered, ships in days, and installs in minutes with a peel-and-stick mount, no wiring, no IT project, no professional installation. For a store that only exists for a weekend or a season, that speed is the whole point.
Once it is up, Dor counts everyone who enters automatically and shows your traffic by hour and by day. Connect it to your point-of-sale system and it reveals your conversion rate, so you can see not just how many people came but how many bought. Because the sensor uses 100% anonymous thermal sensing with no cameras and no personal data, there is nothing to slow down deployment and nothing to worry your legal team, which matters when you are dropping into a shared or public space.
And because the same sensor moves with you, the pop-up you run this month becomes a clean, comparable data point against the one you run next month. Over a few activations, you stop guessing which locations and formats work and start knowing.
A pop-up is a bet on attention. The brands that keep winning that bet are not the ones with the flashiest selfie wall. They are the ones who can prove, with real numbers, that the attention turned into visits, and the visits turned into sales.
Planning a pop-up and want to actually measure it? Book a Dor demo or see pricing and start counting what matters from day one.
Sources
- Shopify, "Popup Shop Marketing: 2026 Guide to Planning and Promotion" (citing AnyRoad 2024 experiential marketing data), shopify.com
- AnyRoad, "2024 Experiential Marketing Benchmark Report", anyroad.com
- Placer.ai, "2024 Retail Foot Traffic Recap", placer.ai
- Placer.ai, "June 2026 Mall Index: Momentum Heading Into H2 2026", placer.ai
- Coresight Research, "July 2026 US Retail Sales Outlook", coresight.com