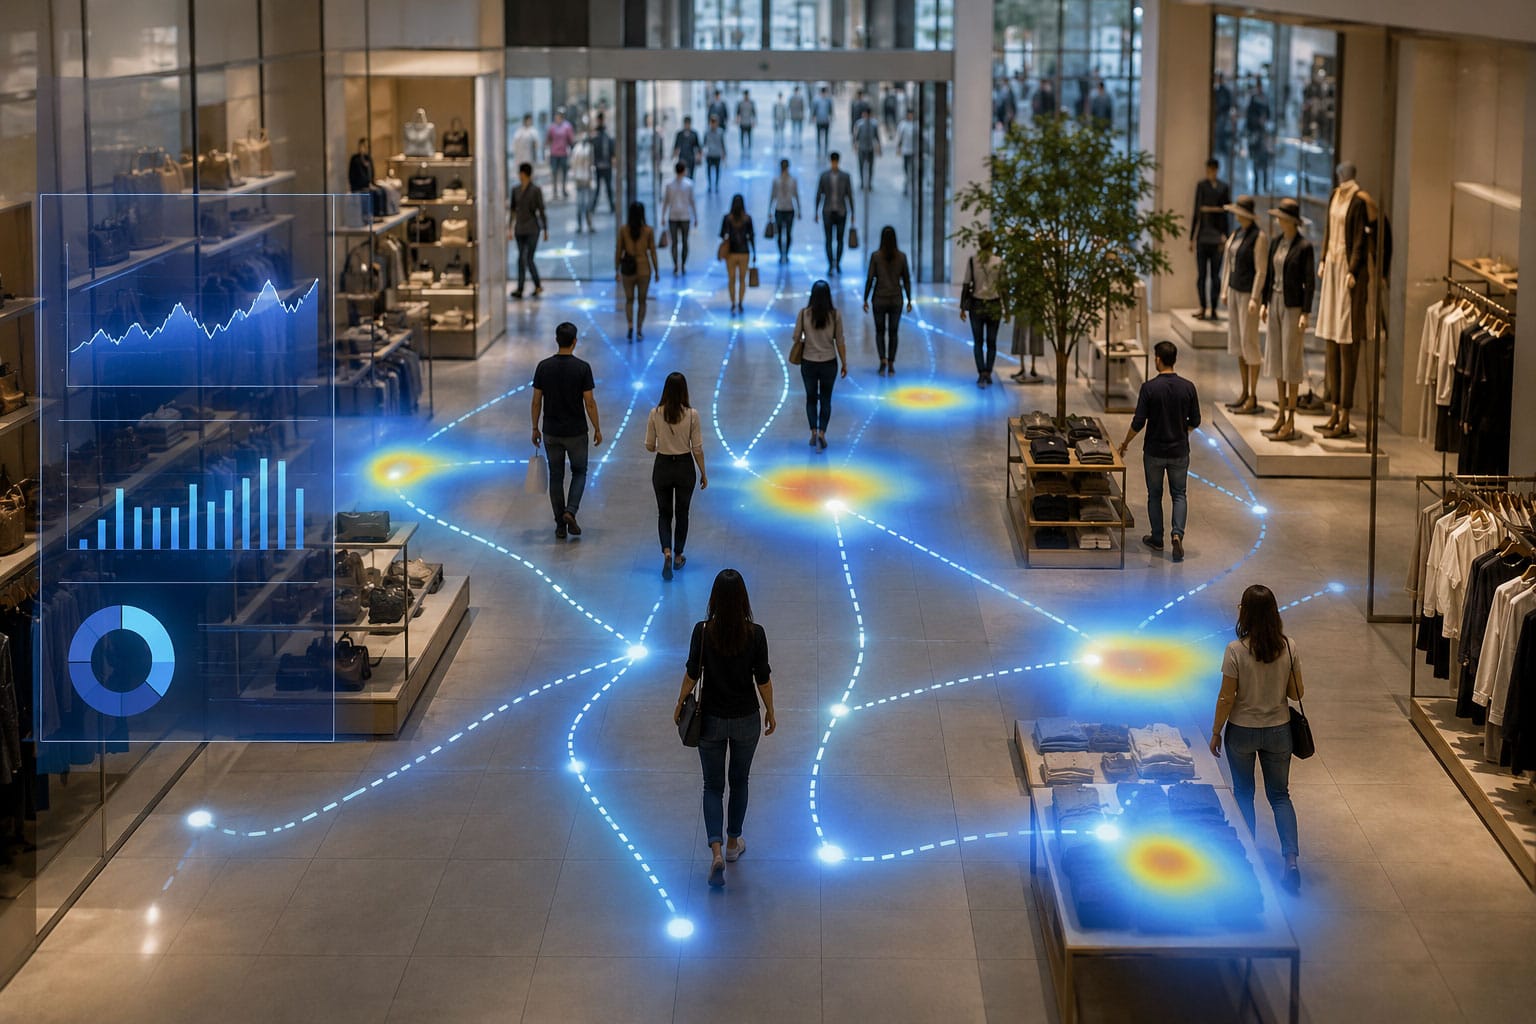
Every day, people walk into your store, look around, and leave. Some buy. Most don't. And unless you're counting, you have no idea how many fall into each group.
That's the core problem foot traffic analytics solves. It turns the invisible flow of visitors into data you can actually use: to staff smarter, measure whether your marketing is working, and understand why revenue went up (or down) on any given day.
If you run an independent retail store, this isn't just a "nice to have" anymore. The retailers who track foot traffic consistently make better decisions. The ones who don't are guessing. Here's everything you need to know to stop guessing.
What Is Foot Traffic Analytics?
Foot traffic analytics is the practice of counting how many people enter your store and using that data to make better business decisions. At its simplest, it's a number: 200 visitors today, 180 yesterday. But the real value comes from what you do with that number.
When you combine visitor counts with your POS sales data, you get your store's conversion rate: the percentage of visitors who actually make a purchase. That single metric tells you more about your store's health than raw sales figures ever could.
Here's why. Imagine your sales drop 15% in a week. Without traffic data, you might assume demand is down. But if foot traffic actually increased 10% that same week, you have a very different problem. Your store is attracting more people but converting fewer of them. That points to staffing, merchandising, or customer experience issues, not a demand problem.
91% of clothing retailers don't track this metric at all. They're making decisions without the most fundamental piece of the puzzle.
Why Foot Traffic Data Matters for Independent Retailers
Big-box chains have had access to foot traffic analytics for years. They use it to benchmark locations, forecast demand, and justify marketing spend across hundreds of stores. Independent retailers typically haven't had the same access, either because the technology was too expensive, too complicated, or required IT infrastructure they didn't have.
That's changed. The cost and complexity have dropped dramatically, which means independent store owners can now make the same data-informed decisions that national chains have relied on for a decade.
Here's what foot traffic data actually unlocks:
Staffing That Matches Reality
Staffing is the single biggest controllable expense for most retailers, and most stores get it wrong. Research shows that retail stores are mis-staffed roughly 86% of the time: either too many employees during slow periods (wasting payroll) or too few during peak hours (losing sales).
Foot traffic data fixes this by showing you exactly when shoppers arrive. Instead of scheduling based on habit or gut feel, you can align your team's hours to your actual traffic patterns. If your data shows a consistent spike between 11 AM and 2 PM on Saturdays, that's when you want your best salespeople on the floor.
Marketing ROI You Can Actually Measure
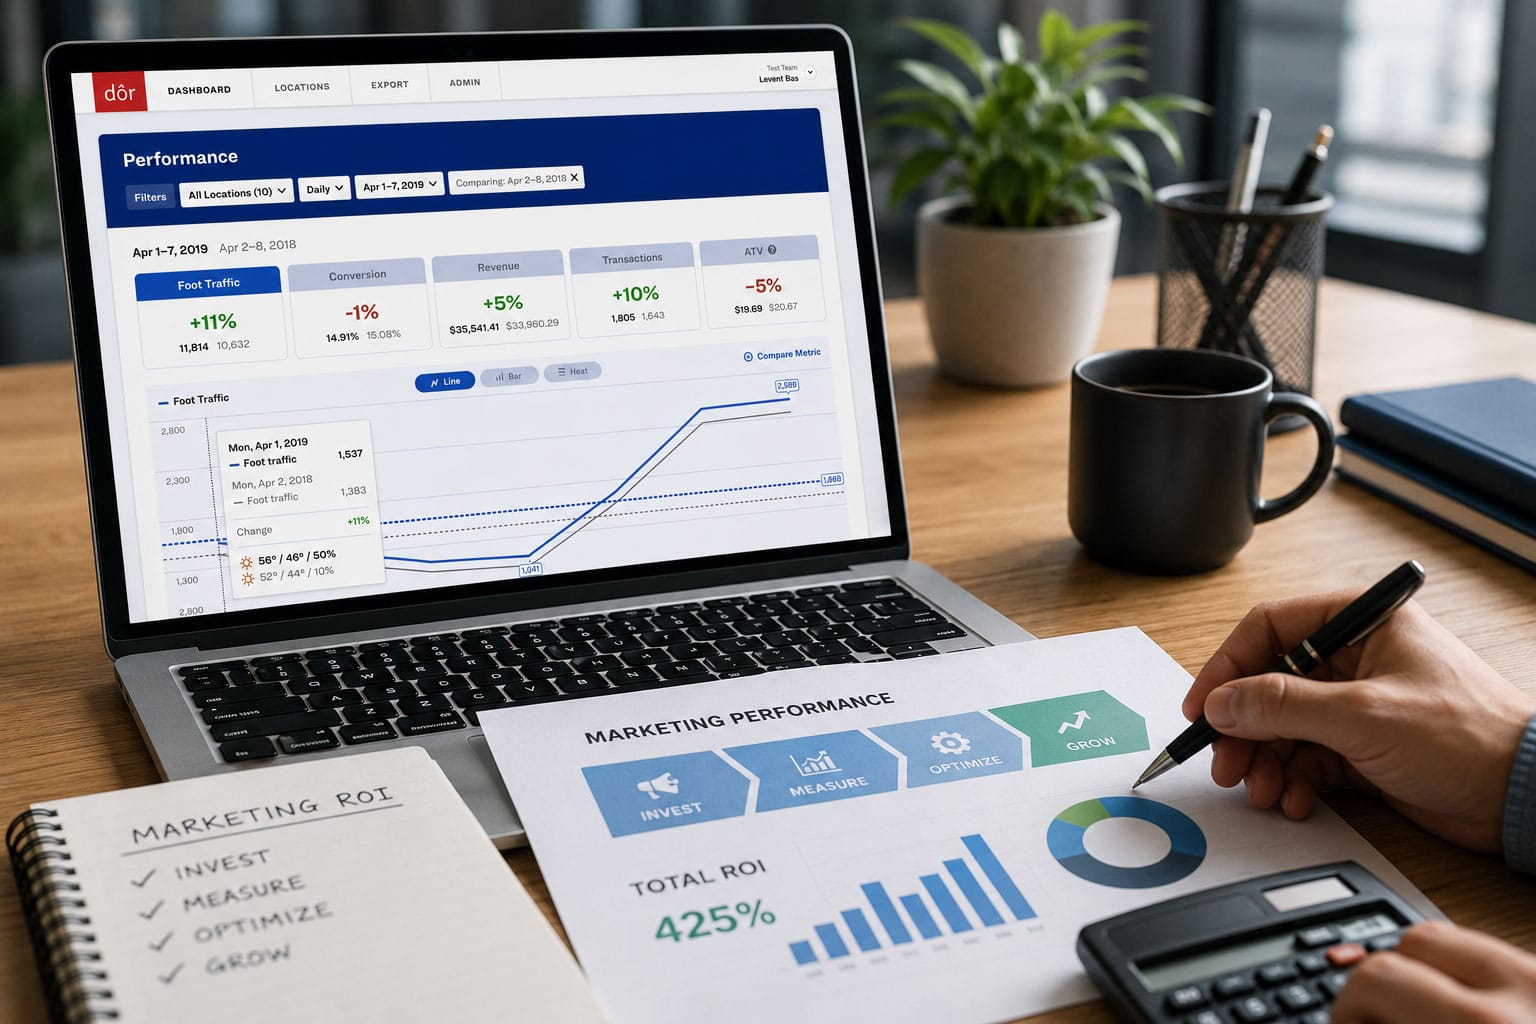
You ran a local ad campaign, posted on social media, or hosted an in-store event. Did it work? Without traffic data, the only way to measure success is to look at sales. But sales are a lagging indicator that mixes multiple factors together.
Foot traffic gives you the leading indicator. If your campaign brought 30% more visitors through the door but sales only increased 10%, you know the campaign drove awareness but your in-store experience needs work. If traffic stayed flat, the campaign didn't land. Either way, you have a clear answer instead of a shrug.
According to industry data, 47% of retail marketing spend goes unjustified because store owners can't connect campaigns to foot traffic changes.
Spotting Revenue Leaks Before They Drain You
A 10% drop in your conversion rate can cost an independent retailer $5,000 to $7,000 in lost revenue before anyone notices. Without traffic data, that drop is invisible. Sales might look "okay" because foot traffic happened to be up that month, masking the fact that fewer visitors are buying.
Tracking conversion rate week over week gives you an early warning system. If it dips, you can investigate immediately: Was the store understaffed? Did a merchandising change confuse the layout? Is a new competitor drawing away your buyers? You can't fix what you can't see.
How Foot Traffic Analytics Works
The basic concept is straightforward: a sensor at your entrance counts people walking in and out. The data feeds into a dashboard where you can see traffic by hour, day, week, or month. Combine it with your POS system, and the dashboard calculates your conversion rate automatically.
The technology behind the sensor varies quite a bit, though, and the differences matter for independent retailers.
Sensor Types at a Glance
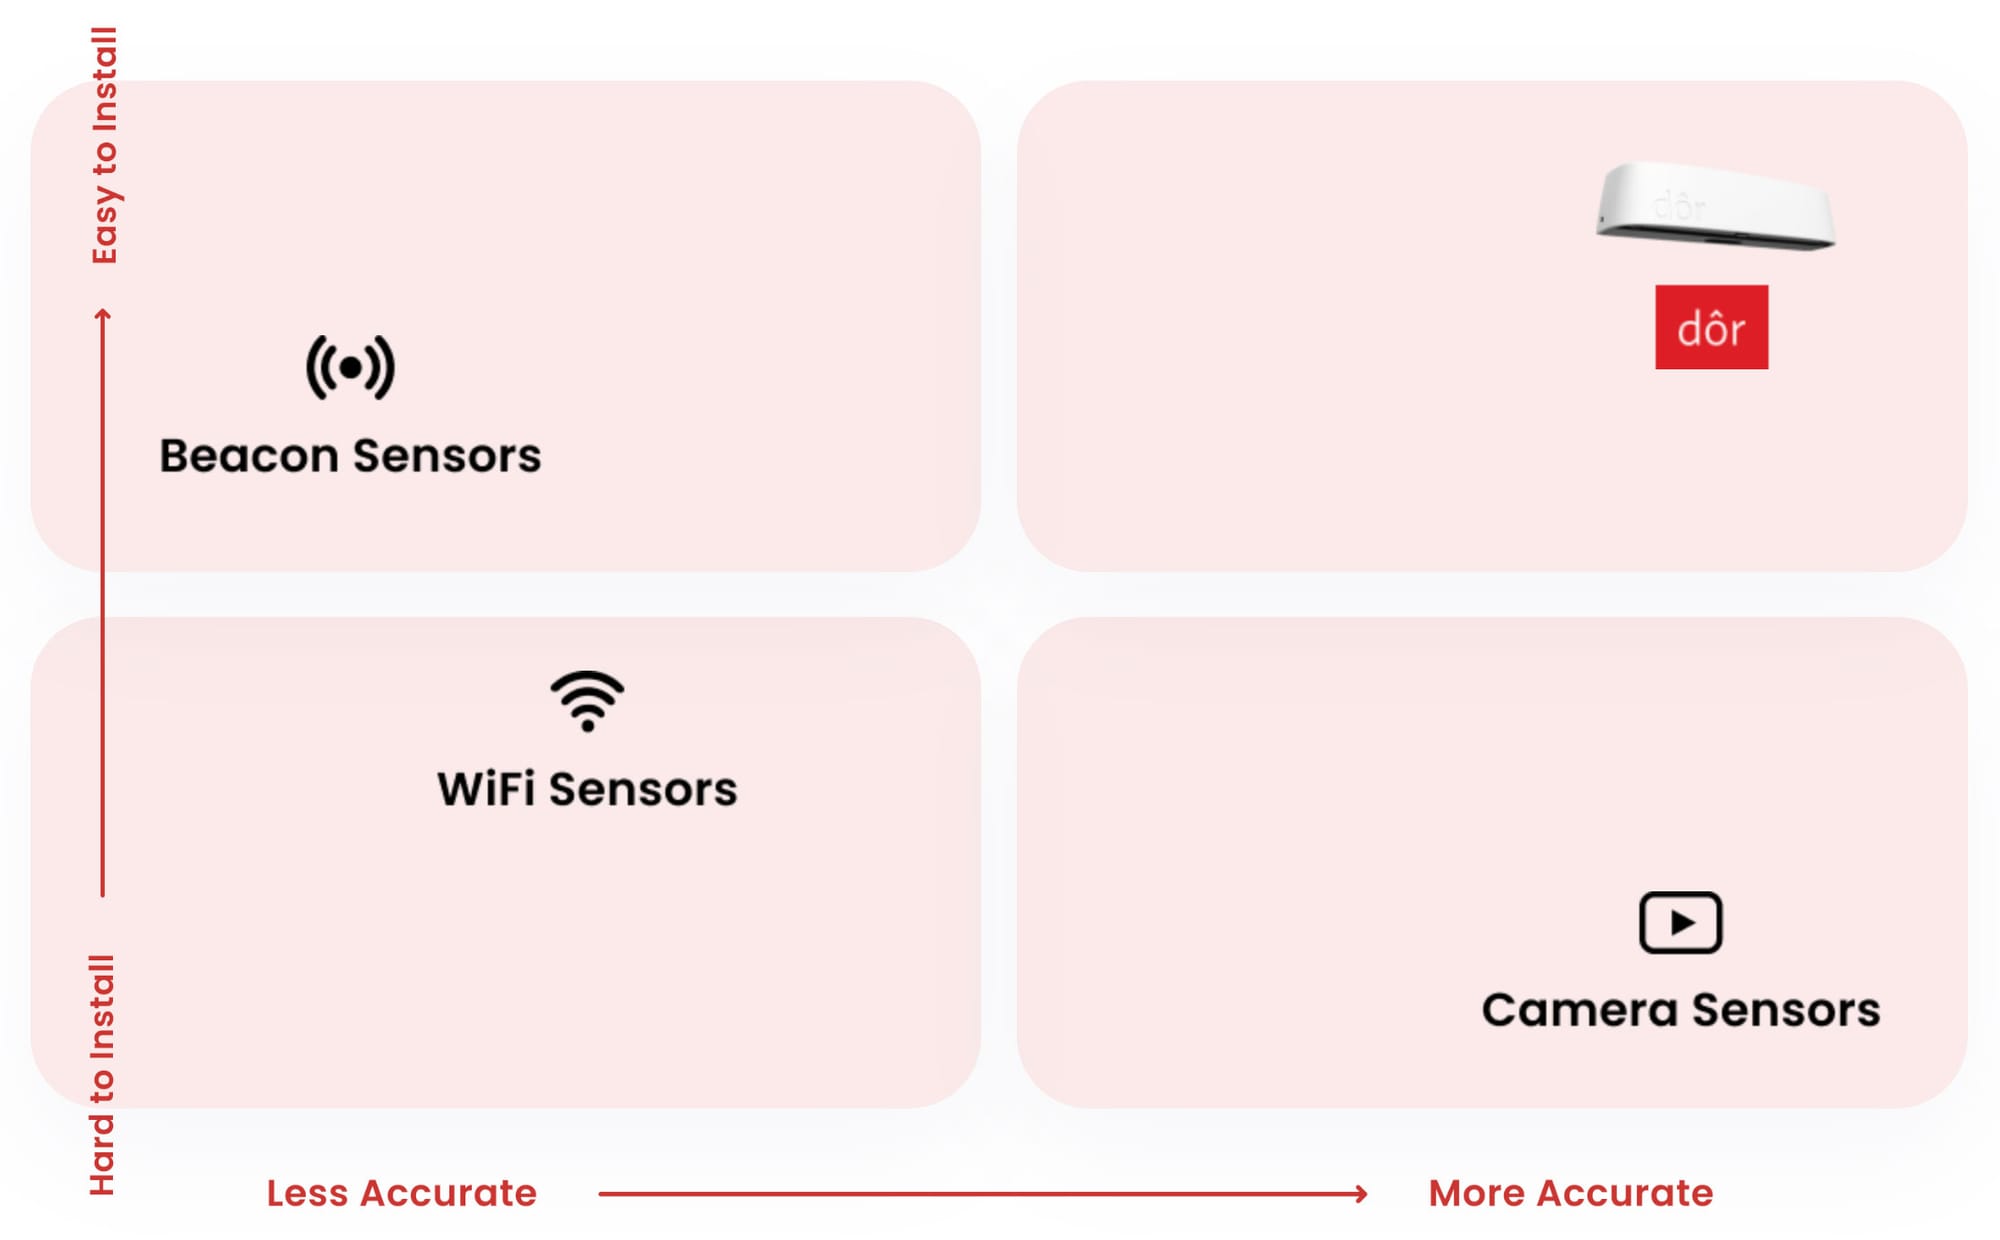
Thermal sensors detect body heat as people walk through a doorway. They don't capture images or personal information of any kind. They simply register "a person passed." This makes them inherently privacy-safe and GDPR-compliant without any special configuration. Modern thermal sensors use machine learning to match camera-level accuracy while running on batteries with no wiring required.
Camera-based counters use overhead cameras and computer vision to count people. They can be very accurate but come with significant trade-offs: they capture identifiable images (creating privacy and compliance risks), require IT infrastructure to install, and typically need hardwired power and network connections.
Wi-Fi/Bluetooth sensors detect the signals from smartphones. Their accuracy depends heavily on whether visitors have Wi-Fi enabled on their phones, which has declined as phone manufacturers have added privacy features. They're less reliable as a counting method and better suited for dwell-time analysis.
Manual clickers are free and familiar, but wildly inconsistent. Staff forget, counts vary by person, and you can't break the data down by hour or compare across days without a spreadsheet and a lot of discipline.
For most independent retailers, the key trade-off is between accuracy, privacy, and ease of installation. You want something that counts reliably, doesn't create compliance headaches, and doesn't require you to call an IT team.
What to Look for in a Foot Traffic Analytics System
Not all systems are created equal. If you're evaluating options for your store, here are the things that actually matter:
Accuracy
This is non-negotiable. If the count is off by 20%, every decision you make from it will be wrong. Look for systems that can demonstrate camera-matching accuracy, ideally backed by independent testing or a large installed base you can reference. A sensor deployed in 2,000+ stores has a very different track record than a startup with 50.
Privacy Compliance
If your sensor captures images or personally identifiable information, you take on regulatory risk. GDPR in Europe, CCPA in California, and an increasing patchwork of state-level privacy laws in the US all apply to in-store data collection. Thermal sensors sidestep this entirely by capturing heat signatures instead of images, so there's nothing to comply with because no personal data is collected in the first place.
Ease of Deployment
Ask yourself: can I install this in 15 minutes without calling anyone? If the answer is no, factor in the real cost of installation, including time, IT support, and any construction work for running cables. Battery-powered, cellular-connected sensors that use peel-and-stick mounting are the lowest-friction option available. No wires, no Wi-Fi dependency, no IT tickets.
POS Integration
Traffic data alone is useful. Traffic data paired with your sales data is transformative. Make sure any system you're considering integrates with your POS (Shopify, Square, Lightspeed, Vend, or whatever you use) so conversion rate is calculated automatically rather than requiring manual math.
Dashboard Usability
You shouldn't need a data science degree to read your analytics. Look for a dashboard that shows you the metrics that matter (traffic, conversion, peak hours) in a format you can understand in under 30 seconds. If you're managing multiple locations, location comparison should be built in.
Getting Started: Your First 30 Days with Foot Traffic Data
If you've never tracked foot traffic before, here's a practical roadmap for your first month.
Week 1: Baseline
Install your sensor and let it collect data. Don't change anything about how you run the store. The goal this week is to establish your baseline: average daily traffic, peak hours, and (once your POS is connected) your current conversion rate.
Most store owners are surprised by what they find. The peak hour you thought was busiest often isn't. And your conversion rate is almost certainly lower than you'd guess, simply because you've never had the data to calculate it.
Week 2: Identify Patterns
With a full week of data, start looking for patterns. Which days are busiest? When do traffic peaks and valleys happen within the day? Does weekend traffic look fundamentally different from weekday traffic?
Map these patterns against your current staff schedule. You'll likely spot at least one shift that's overstaffed for a slow period and one peak that's understaffed. That's your first optimization opportunity.
Week 3: Make One Change
Pick the single clearest insight from your data and act on it. Maybe it's shifting a staff member's hours to cover the Saturday 11 AM to 2 PM rush. Maybe it's moving your window display changeover to Monday morning, after you've seen that Tuesday through Thursday drive the most new visitor traffic.
One change, measured against the data. This is how you build a habit of data-informed decisions rather than trying to overhaul everything at once.
Week 4: Measure and Expand
Compare your Week 3 and Week 4 numbers to your baseline. Did conversion rate improve? Did staffing efficiency change? Use this as your proof point to justify continued investment in analytics, and to decide what to optimize next.
If you run multiple locations, this is the point where you start benchmarking stores against each other. Location comparisons often reveal that your "best" store (by raw sales) isn't your most efficient one (by conversion rate), and the underperforming location might just need a staffing tweak to catch up.
Common Questions Independent Retailers Ask
"How much does foot traffic analytics cost?"
The range is wide. Camera-based enterprise systems can run tens of thousands of dollars. At the other end, modern thermal sensors like Dor cost $300 per sensor with software starting at $150 per month per sensor ($135 per month on an annual plan). For a single-door independent store, that's a fixed, predictable cost with no IT overhead.
"Is the data really accurate enough to base decisions on?"
With modern machine-learning-powered sensors, yes. The best thermal sensors today match camera accuracy while being significantly easier to deploy. The key is choosing a system with a large enough installed base to have refined its algorithms over millions of real-world counts. Dor's sensors are deployed in over 2,000 retail stores, with accuracy validated against camera benchmarks.
"What if my store has multiple entrances?"
Add a sensor to each entrance. Any good analytics platform will aggregate the data into a single traffic number for your store, deduplicating where needed.
"Do I need good Wi-Fi for this to work?"
It depends on the sensor type. Wi-Fi and Bluetooth-based counters obviously need connectivity. Camera systems typically need a network connection. Cellular-connected thermal sensors, like Dor's, connect over their own cellular radio and don't depend on your store's Wi-Fi at all, which removes one more deployment barrier.
"How is this different from what my POS already shows me?"
Your POS tells you about transactions: who bought, what they bought, and when. But it tells you nothing about the people who walked in and didn't buy. Foot traffic analytics fills that gap by counting everyone who enters, whether they purchase or not. The combination of POS data and traffic data gives you conversion rate, which is the metric that connects marketing, operations, and sales into one picture.
The Bottom Line
Foot traffic analytics isn't complicated. It's counting people, pairing that count with your sales data, and using the result to make better decisions about staffing, marketing, and store operations.
Independent retailers have operated without this data for decades because the technology was expensive and hard to install. That's no longer the case. Today, you can have a sensor on your door in 15 minutes, connected to your POS, showing you your real conversion rate by the end of the week.
The question isn't whether foot traffic analytics is worth it. It's how long you're willing to keep guessing.
If you're ready to see what your store's data actually looks like, Dor makes it easy to get started with a peel-and-stick thermal sensor, no IT required. Backed by a 30-day money-back guarantee, there's no risk in finding out what you've been missing.