Most store owners check two systems in the morning. POS for yesterday's sales. Foot traffic counter (if they have one) for visitors. The math that actually matters, your store's conversion rate, lives in the gap between them.
A store conversion rate dashboard closes that gap. Instead of two screens, you get one number you check with coffee: did more visitors actually buy yesterday than the week before? Setting one up takes an afternoon. Running it takes five minutes a day. This guide walks you through the whole thing.
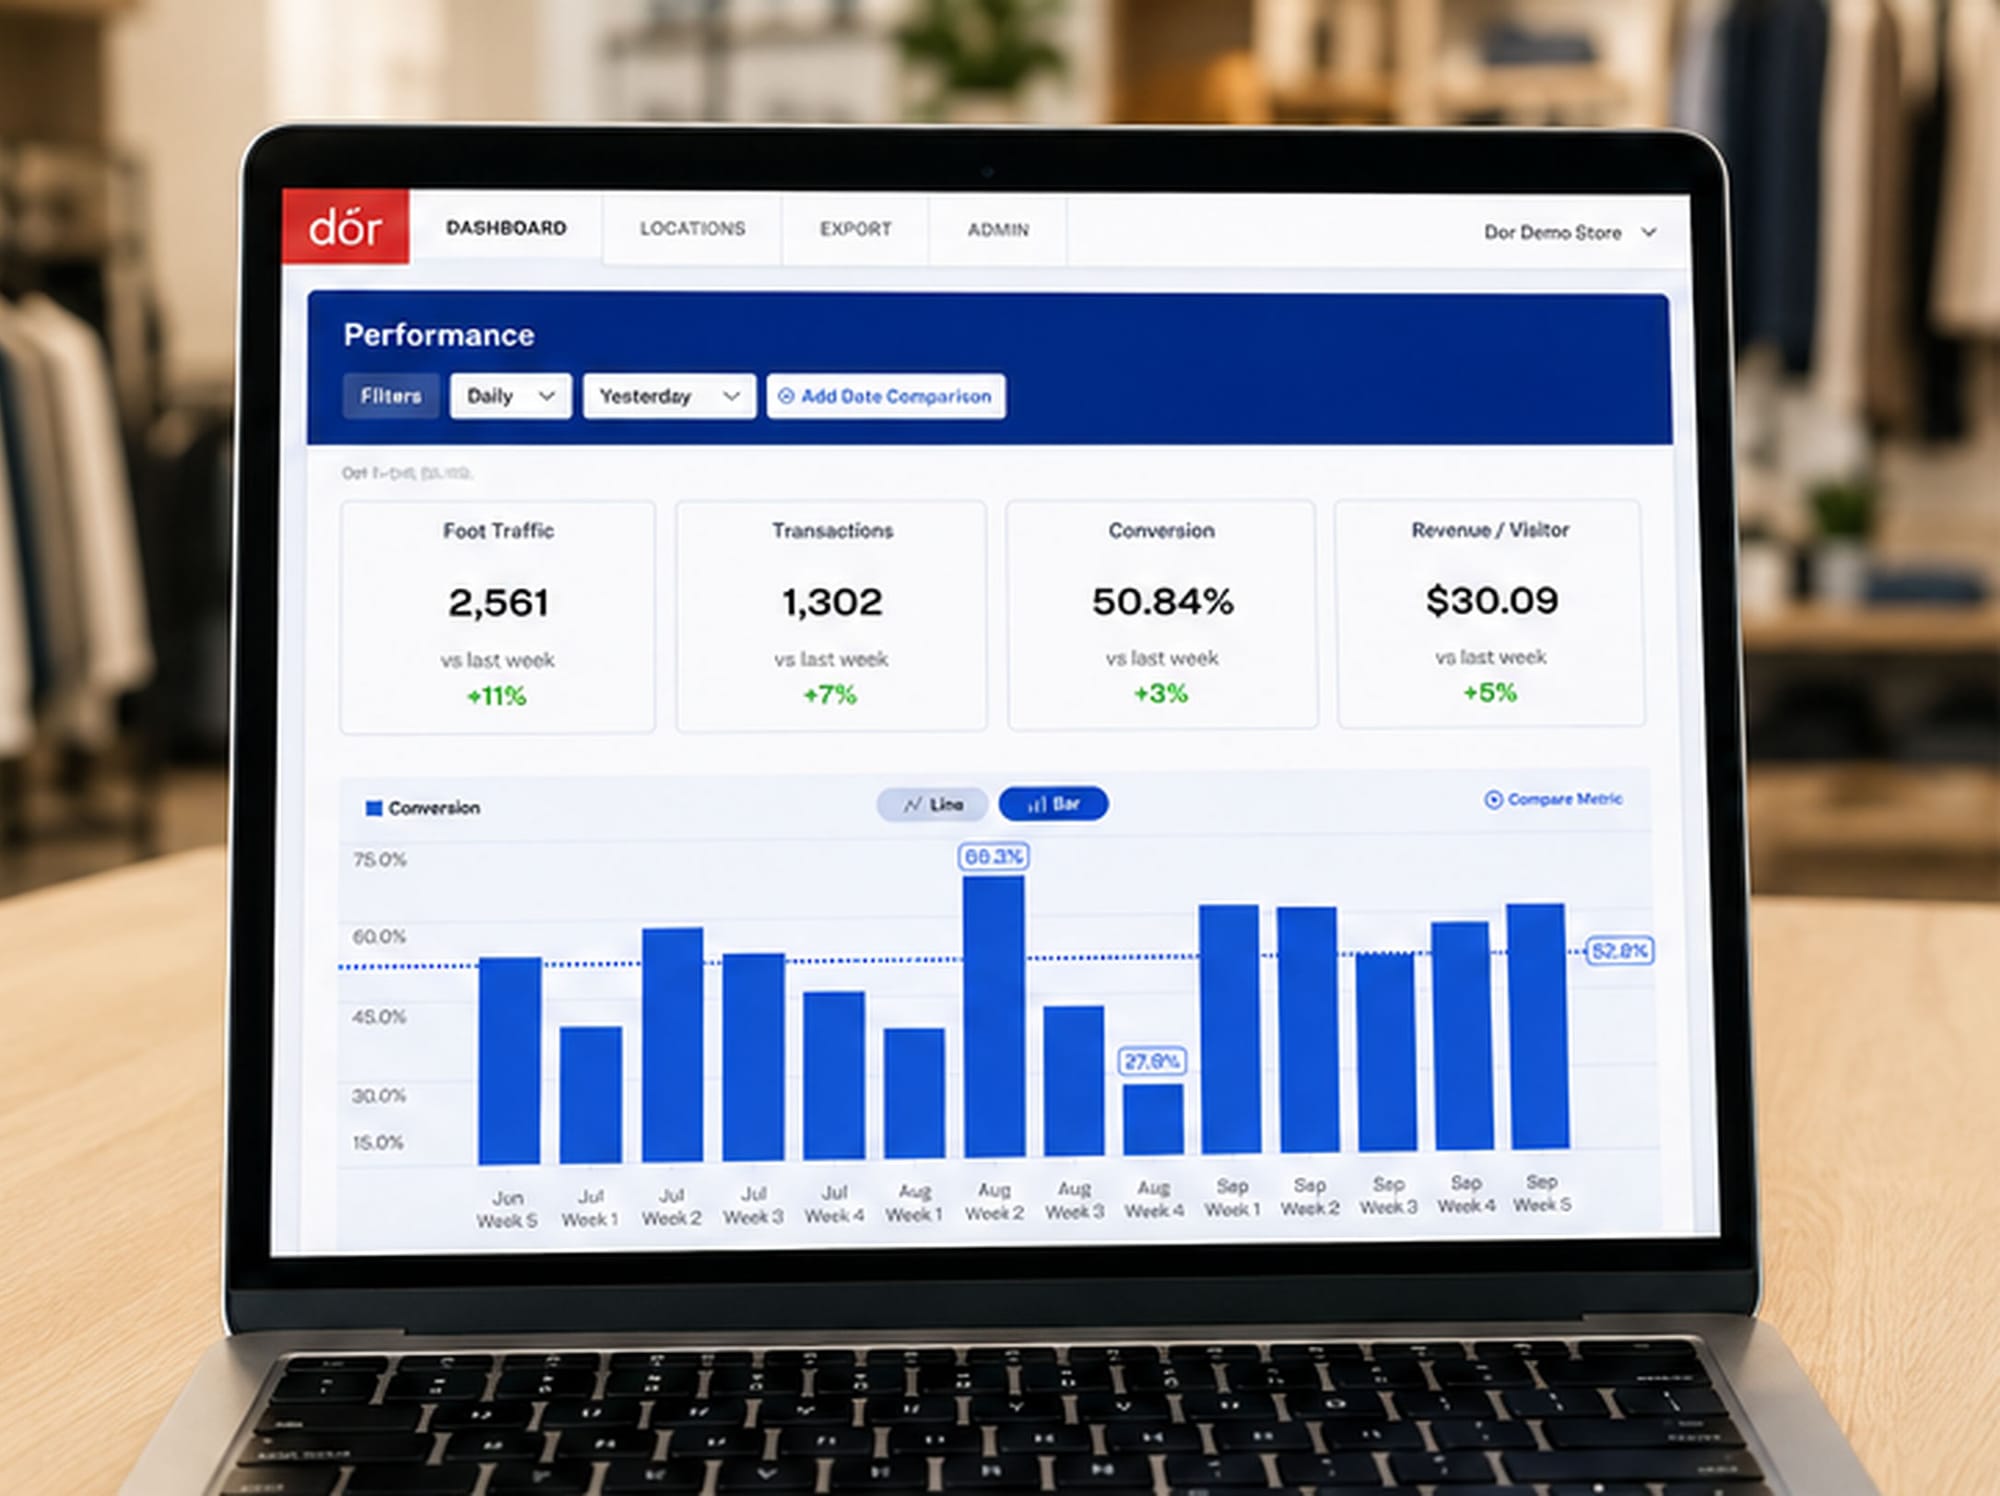
What goes on a store conversion rate dashboard
The mistake most retailers make is trying to track twenty things. A useful daily dashboard has four numbers:
- Visitors. How many people walked through the door.
- Transactions. How many bought something.
- Conversion rate. Transactions divided by visitors, expressed as a percentage.
- Revenue per visitor. Total sales divided by visitors.
If you've never measured these together, conversion rate is the most important metric you're probably missing. The other three give it context. That's it. Resist the urge to layer on net promoter scores, repeat customer rates, or basket size breakdowns until you've watched these four for a month and made operational changes based on what they tell you.
Step 1: Connect a foot traffic source
You can't calculate conversion without knowing how many people came in. If you already have a people counter, skip ahead. If you don't, the simplest path is a thermal sensor mounted at the entrance.
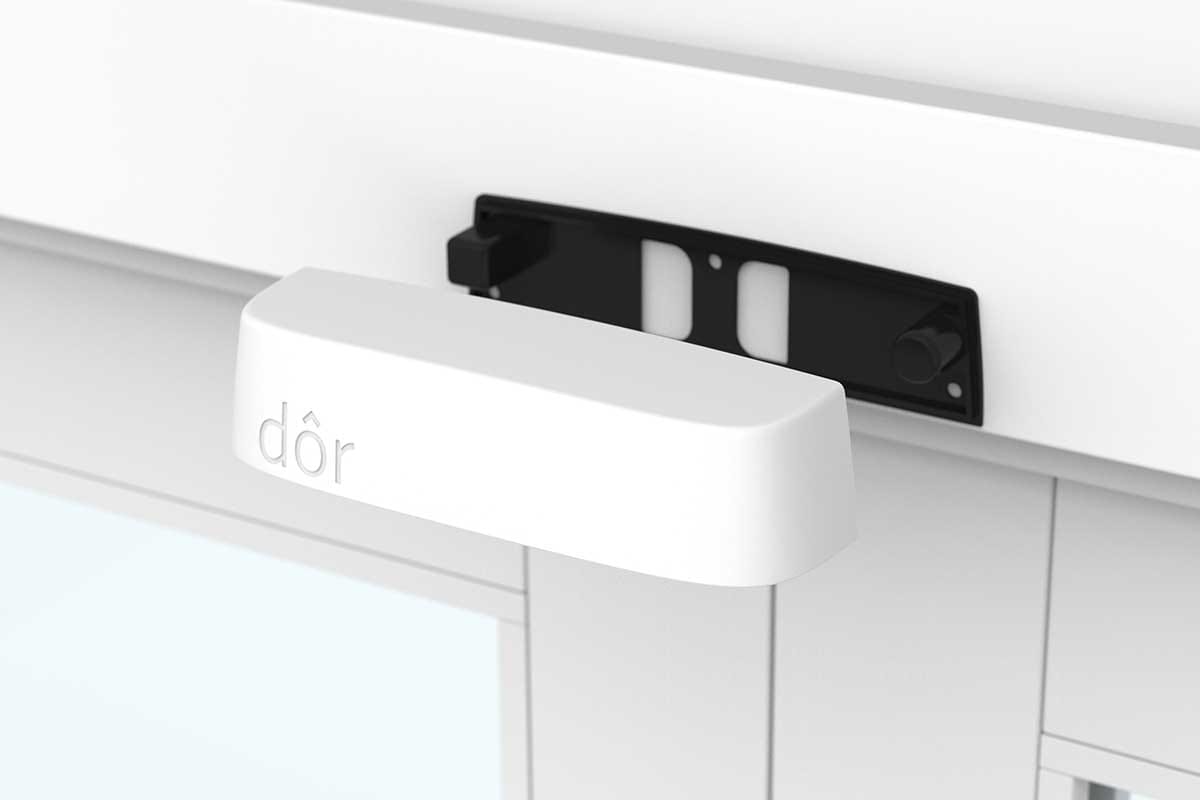
Thermal sensors count silhouettes, not faces, so you avoid the privacy and IT complications that come with cameras. The Dor sensor peels and sticks above the door in about five minutes, runs on battery for two years, and connects over cellular. No Wi-Fi setup, no electrician, no open ports.
Once it's installed, visitor counts populate in your dashboard within minutes. If you're still choosing between sensor types, we covered the tradeoffs between thermal and camera counters here.
Step 2: Connect your POS
This is usually the slowest step, but it's simpler than it sounds. Most modern POS systems (Shopify, Square, Lightspeed, Clover, Vend) have direct integrations with retail analytics platforms. You'll need:
- Admin access to your POS
- Five to ten minutes to authorize the connection
- A time-zone confirmation so traffic and transaction data line up
What you're pulling in is transaction count and gross sales by time of day. You don't need basket-level detail for a conversion dashboard. Hourly totals are enough.
If your POS doesn't have a direct integration, most platforms let you upload daily sales as a CSV. It's clunky but workable until you upgrade.
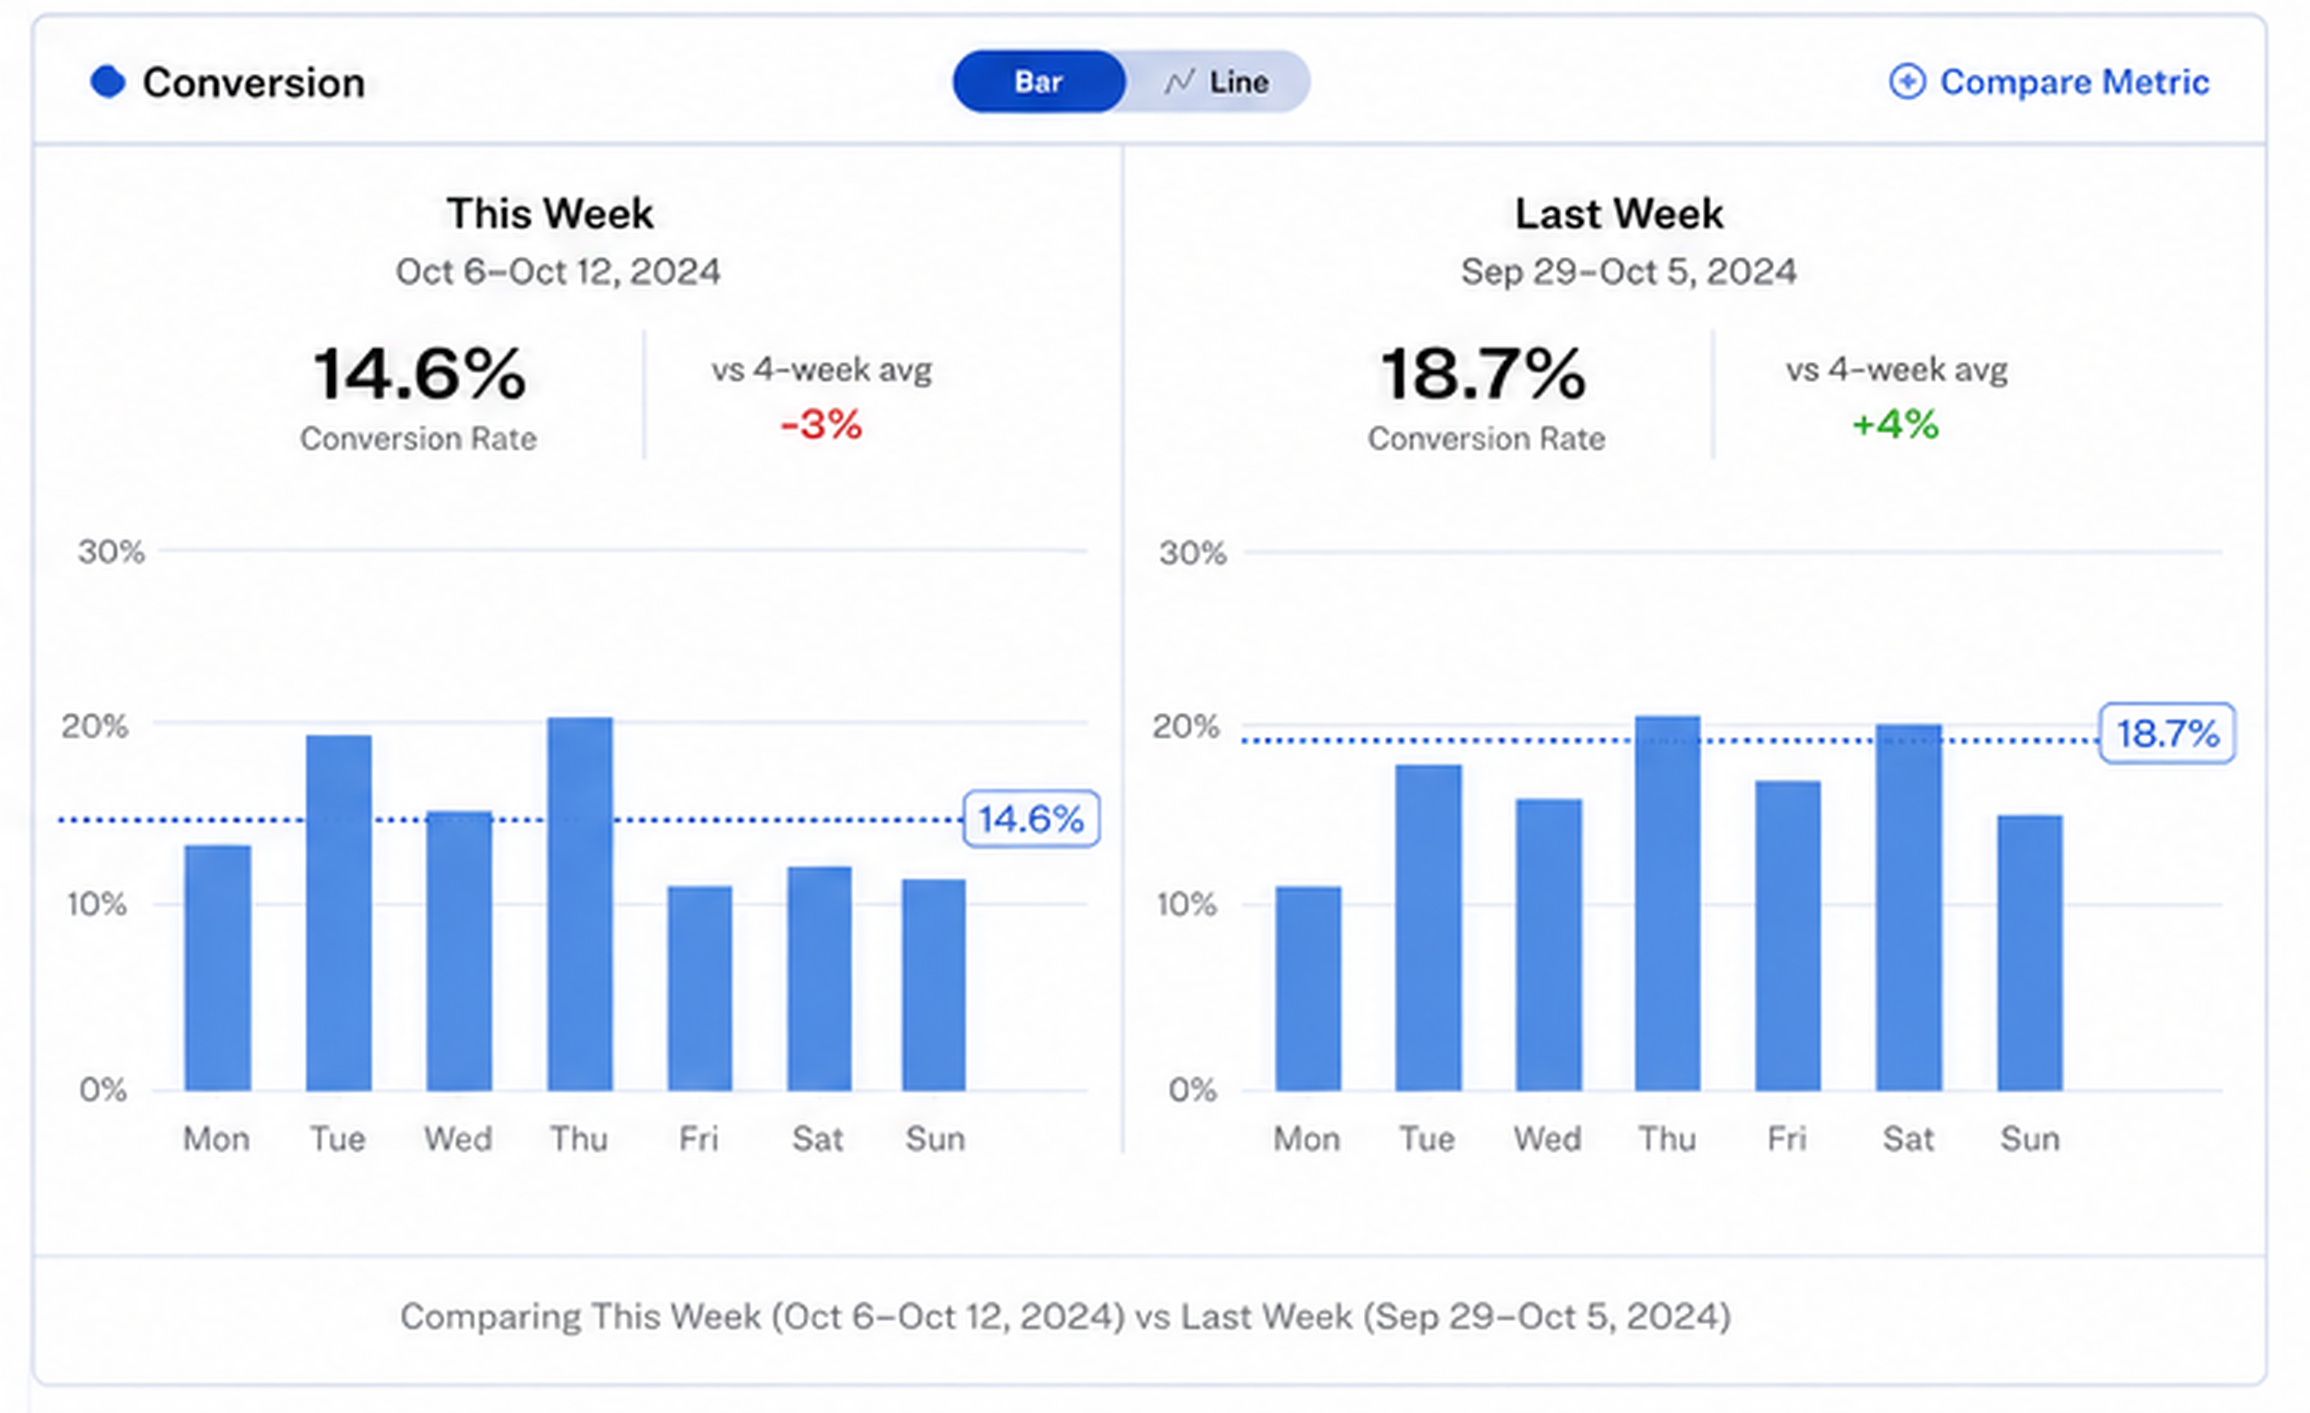
Step 3: Pick your comparison windows
A single day's conversion rate by itself doesn't tell you much. Context comes from comparison. Set your dashboard to show:
- Yesterday vs. the same day last week. Catches week-over-week trends without weekend distortion.
- This week vs. the four-week average. Smooths out one-off events.
- Hour-by-hour today vs. typical. Surfaces problem windows (Saturday at 2pm always converts well, but it tanked yesterday).
If your dashboard only shows raw numbers, you'll struggle to act on them. Comparisons are what turn data into decisions.
Step 4: Set thresholds you'll actually notice
Numbers in a dashboard go unread unless something stands out. Build in two thresholds:
- A healthy range for conversion rate based on your last 90 days. Most independent retailers land somewhere between 15% and 30%, but yours is whatever yours is.
- An alert threshold. Say, anything more than 20% below your four-week average.
When conversion dips below the alert line on a Wednesday morning, you'll know to look at Tuesday's staffing, not just Tuesday's sales. That's the whole point. A conversion drop quietly costs an average store $5,000 to $7,000 per 10% slip, and it almost always traces back to staffing, layout, or stock-outs you can fix.
Step 5: Build the five-minute morning habit
The best dashboard in the world is useless if no one looks at it. Pin it to your phone's home screen, your laptop's first tab, or print yesterday's summary and hand it to your floor manager before opening.
What you're looking for each morning:
- Did yesterday's conversion match the trailing average?
- If it dropped, which hours did it drop in?
- What was different about that hour (weather, staffing, a promotion ending)?
That's three questions. Answering them honestly is what separates retailers who use their dashboards from retailers who just installed one.
Common setup mistakes
A few traps we see often:
- Tracking too many metrics on day one. Start with four. Add complexity only after you've made operational decisions based on the basics for at least a month.
- Ignoring hour-by-hour data. Daily totals mask the patterns that matter for staffing. Always drill down to the hour.
- Setting the dashboard up, then never tuning it. Your first comparison windows are a guess. Revisit them at 30 days and adjust.
- No accountability for who reviews it. If everyone owns the dashboard, no one does. Assign one person per location.
What the dashboard unlocks
A store conversion rate dashboard isn't just a reporting tool. Once you have the four numbers flowing reliably, foot traffic analytics gives you a whole second layer of decisions: staffing optimization, marketing attribution, peak-hour planning, and multi-location benchmarking. But none of that works until the basics land in one place every day.
If you want to see what one looks like before building your own, Dor's dashboard is live across 2,000+ retail stores and takes about an afternoon to set up end to end. The sensor goes up first, your POS connects in a few clicks, and the dashboard is reading in real time within a week.