
Your retail conversion rate is the single most important number most store owners never look at. It tells you what percentage of the people who walk through your door actually buy something — and if you're not tracking it, you're making staffing decisions, marketing bets, and layout changes based on gut feel alone.
Here's the formula:
Retail Conversion Rate = (Number of Transactions ÷ Total Foot Traffic) × 100
Simple, right? If 400 people walk into your store on a Saturday and 72 of them make a purchase, your store conversion rate is 18%. But that simplicity hides something important: most retailers know the top number (transactions — your POS tracks that automatically) but have zero visibility into the bottom number (how many people actually entered).
And without that denominator, you're flying blind.
Why Most Retailers Are Flying Blind
A stat that still surprises people in the industry: 91% of clothing retailers don't know their store's conversion rate. Not approximately. Not a rough guess. They simply don't measure foot traffic at all.
Think about what that means in practice. A store manager notices sales dipped 15% last Tuesday compared to the previous week. Was it because fewer people came in? Because the staff wasn't converting browsers into buyers? Because the new window display attracted lookers who weren't in the target demographic? Without foot traffic analytics, every explanation is equally plausible — and equally useless for deciding what to fix.
The downstream effects are brutal. An estimated 86% of apparel stores are chronically mis-staffed, scheduling too many people during dead hours and too few during rushes. That 2 PM Tuesday lull with three associates standing around? That's payroll evaporating. The Saturday afternoon crush where customers can't get anyone's attention? That's revenue walking out the door.
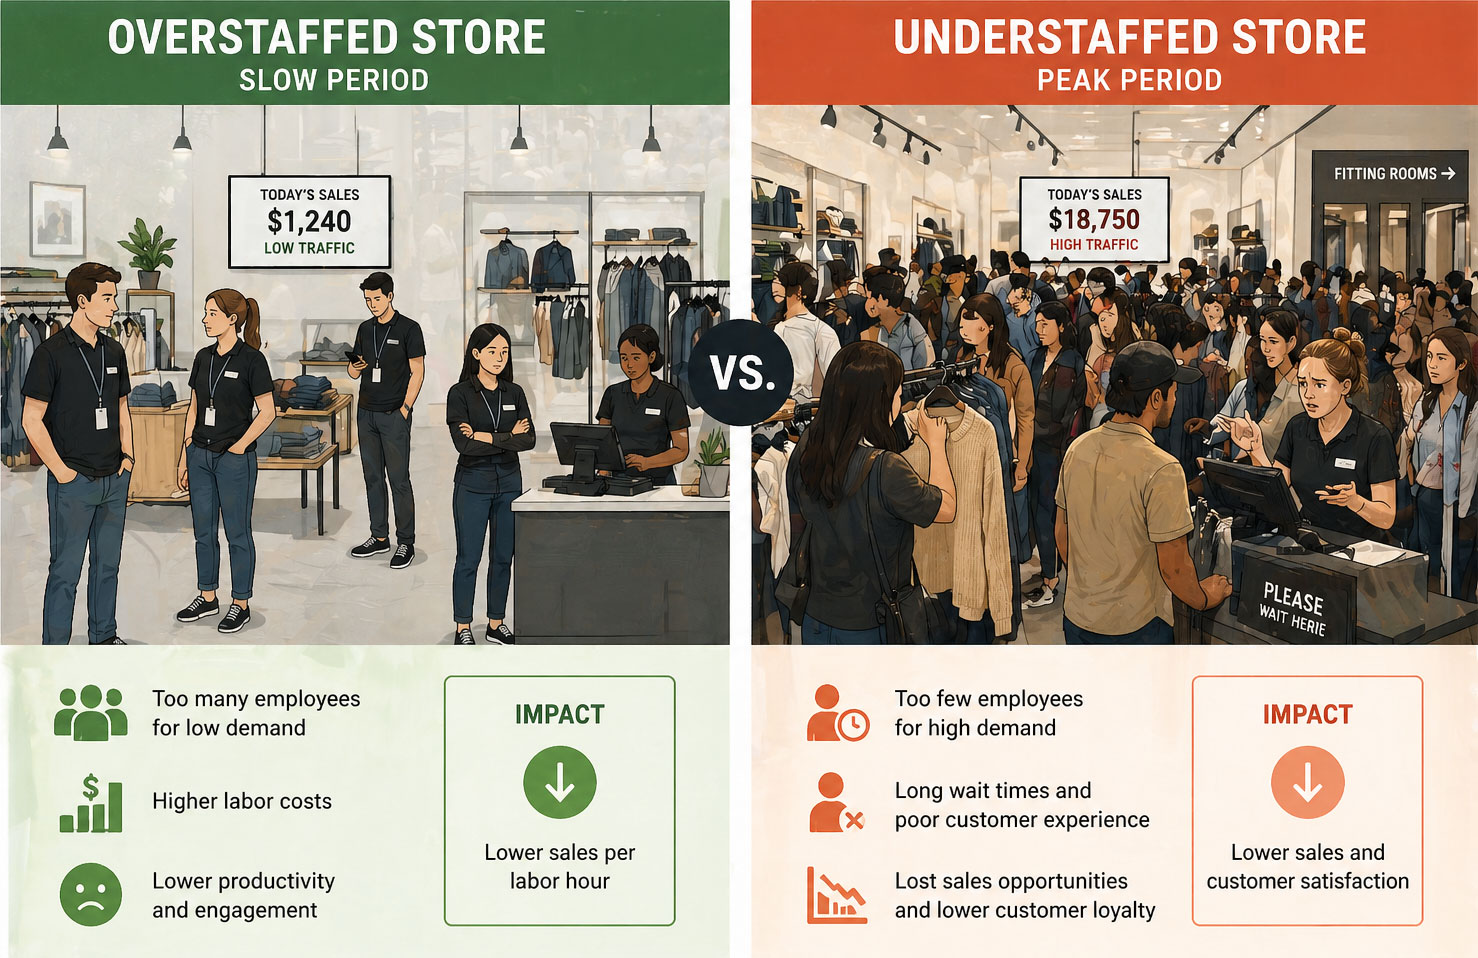
And marketing gets it even worse. Research suggests 47% of marketing spend is unjustifiable without traffic data. You ran a Facebook campaign last month targeting people within 10 miles of the store. Sales went up 8%. Great — was that the campaign? Seasonal lift? A coincidence? If you'd been measuring foot traffic, you'd know whether more people actually showed up. That's the difference between "this campaign worked" and "we think maybe something worked, possibly."
POS data alone tells you who bought. It tells you nothing about who didn't buy — and that's where the real opportunity lives.
What Does a Good Conversion Rate Look Like?
The honest answer: it depends. A convenience store and a luxury jewelry boutique operate in different universes. But after working with enough retail data, some benchmarks hold up across the board.
| Store Type | Typical Conversion Rate | Strong Performance |
|---|---|---|
| Grocery / Convenience | 40–60% | 65%+ |
| Apparel / Fashion | 15–25% | 30%+ |
| Specialty Retail (gifts, home décor) | 10–20% | 25%+ |
| Electronics | 8–15% | 20%+ |
| Luxury / High-end | 5–12% | 15%+ |
| Big-box / Department Store | 20–30% | 35%+ |
A few things jump out from these numbers. High-intent environments (grocery stores, where almost everyone walking in needs something specific) naturally convert at much higher rates. Browsing-heavy formats (fashion, electronics) sit lower because a lot of their foot traffic is aspirational — people looking, comparing, touching fabric, trying things on with no immediate purchase intent.
The number that matters most isn't your absolute conversion rate — it's your trend. Are you improving month-over-month? Does your Friday convert differently than your Wednesday? Did the new floor plan you tested in Q3 move the needle?
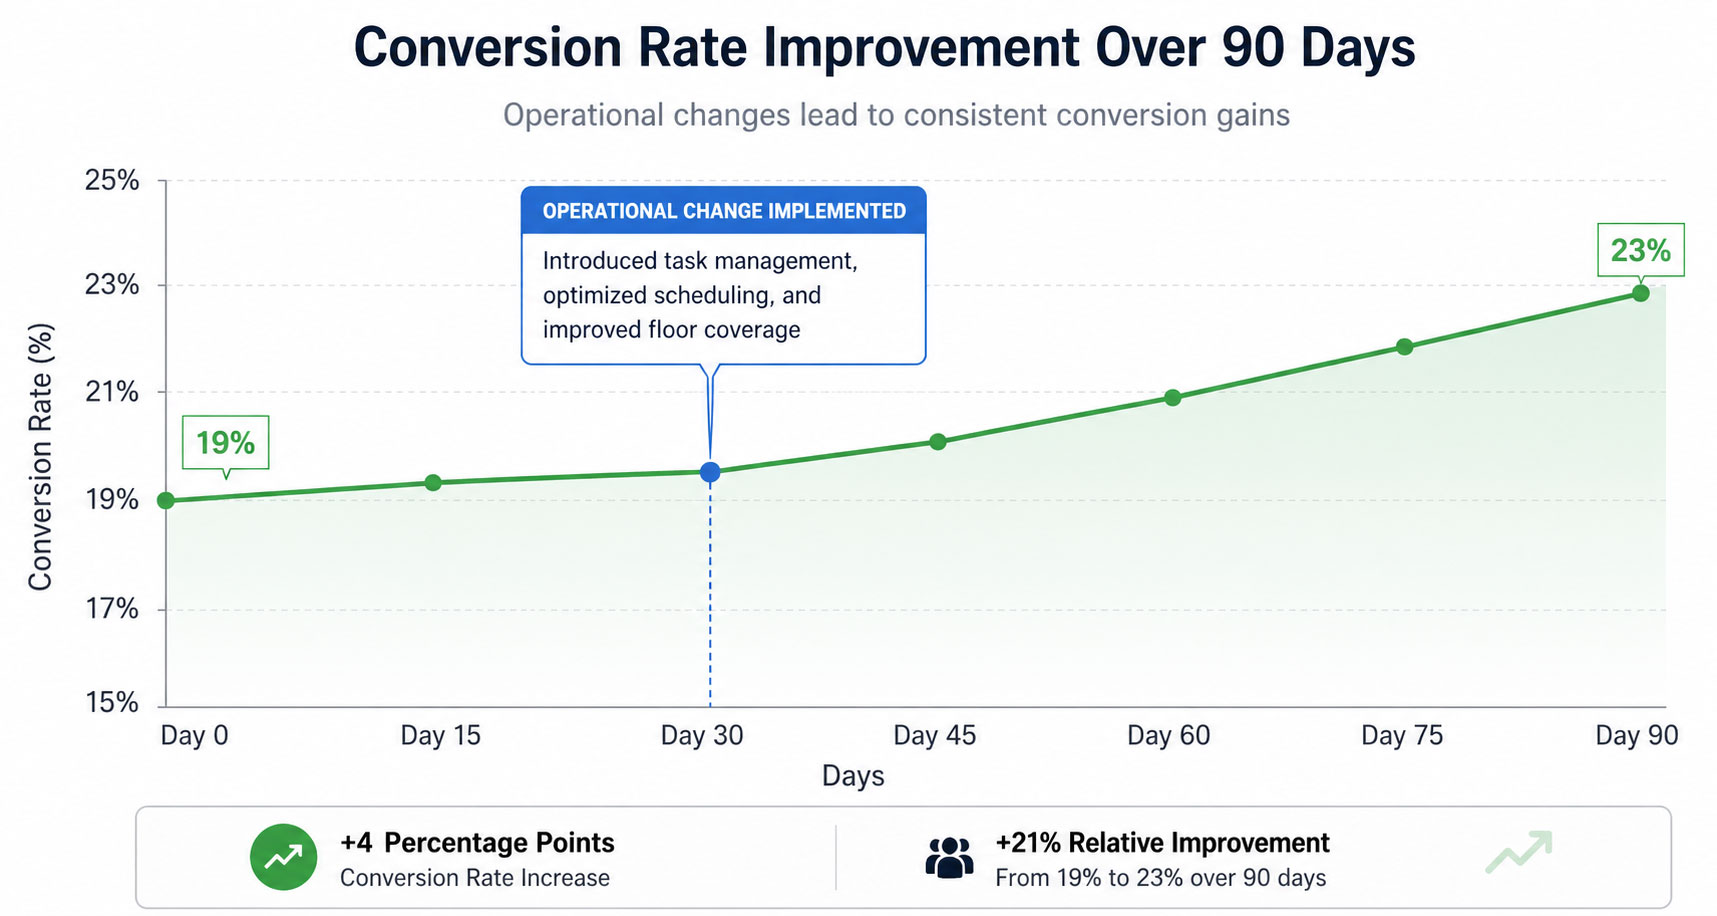
One clothing retailer we've seen tracked a consistent 19% conversion rate across a three-month baseline. After reworking their fitting room process (adding a bell for assistance, pre-staging complementary items), they pushed to 23.4% within six weeks. Same traffic. Same staff count. That 4.4-point improvement translated to roughly $11,200 in additional monthly revenue across their three locations.
Context matters too. Mall locations tend to see lower conversion rates than street-front shops because malls generate more casual foot traffic. Stores near anchor tenants might get lots of pass-through visitors who had no intention of shopping there. Knowing your context helps you set realistic targets instead of chasing someone else's numbers.
The Revenue Math: Why Small Improvements Matter More Than You Think
Here's where conversion rate tracking goes from "nice to know" to "we can't afford not to do this."
Let's run real numbers. Say your store sees 8,000 visitors a month with a 20% conversion rate and a $68 average transaction value.
- Current state: 8,000 × 0.20 = 1,600 transactions × $68 = $108,800/month
- With a 3-point improvement to 23%: 8,000 × 0.23 = 1,840 transactions × $68 = $125,120/month
That's $16,320 more per month — $195,840 per year — from a three-percentage-point improvement. No additional marketing spend. No rent increase. No new inventory. Just converting three more people out of every hundred who already walked in.
Flip it around, and the cost of not paying attention is equally stark. Data from retail operations studies shows that a 10% drop in conversion rate can mean $5,000 to $7,000 in revenue leakage — per store, per month. A bad hire at the fitting room station. A confusing new layout that blocks sightlines to bestsellers. A checkout bottleneck that forms at 4 PM on weekdays. Any of these can quietly erode conversion, and without a people counter feeding you daily data, you might not catch it for weeks.
That's the insidious part. Sales might look "flat" because foot traffic went up 12% while conversion dropped 11%. Your store got busier and worse at selling simultaneously — and your POS data alone would show you nothing unusual.
How to Actually Measure Your Conversion Rate
You need two things: transaction count (easy — your POS handles this) and foot traffic count (harder than it should be). Let's look at the options honestly, including the trade-offs nobody puts in their marketing materials.
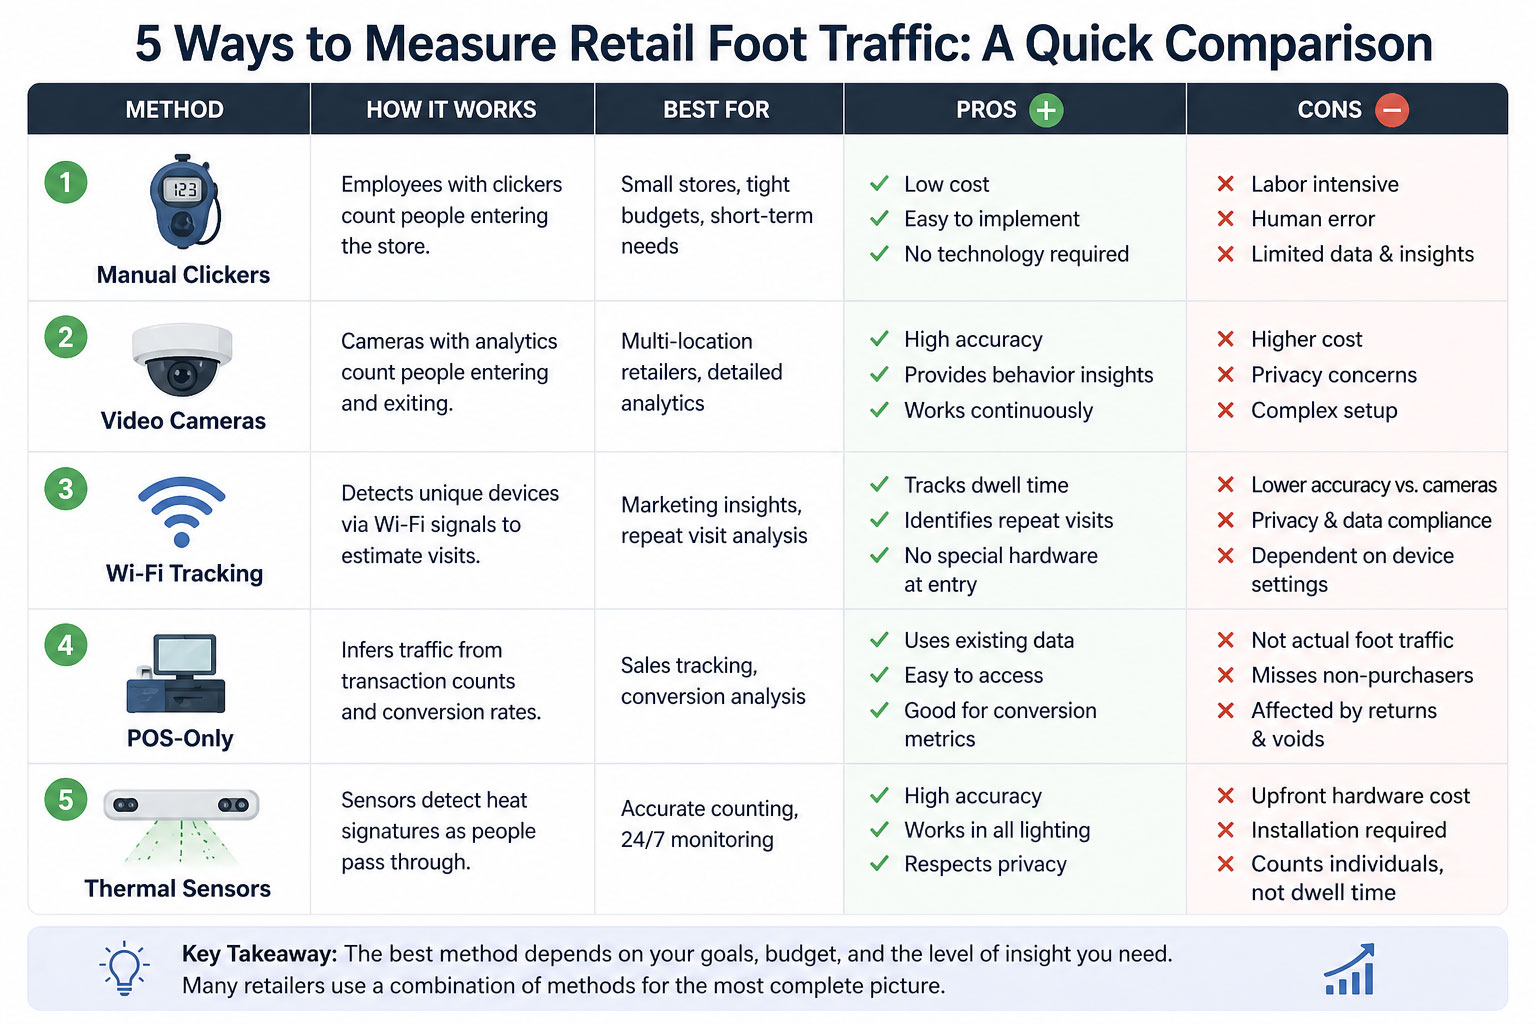
Manual Clickers
The old standby. Somebody stands at the door with a handheld counter. Cost: about $12 for the clicker, plus the labor hours of the person holding it. Accuracy: terrible. Studies have pegged manual counting accuracy at 60–70% on a good day, dropping further during busy periods — exactly when accuracy matters most. Staff forget. They get pulled to help a customer. They double-click. Nobody's doing this at 7:45 AM on a Monday.
Verdict: better than nothing, but barely. Not viable for ongoing measurement.
Camera-Based Systems (Video Analytics)
Ceiling-mounted cameras using computer vision to count and sometimes track shoppers. Accuracy can be quite good — 95%+ in some implementations. But there are real costs: professional installation, wiring, network infrastructure, and ongoing software subscriptions that can run $200–$400 per door per month.
The bigger issue is privacy. Camera-based systems inherently can capture personally identifiable information, even if the vendor says they don't store it. With regulations like GDPR, CCPA, and Canada's PIPEDA tightening every year, the legal and reputational risk of having cameras pointed at your customers' faces is a growing concern for retailers — especially smaller operators without a legal team on retainer.
Wi-Fi and Bluetooth Tracking
These systems detect the signals from shoppers' smartphones. Clever in theory. In practice, accuracy depends entirely on whether customers have Wi-Fi or Bluetooth enabled on their phones. Apple's iOS 14 update in 2020 randomized MAC addresses specifically to prevent this kind of tracking, and Android followed suit. The result? Wi-Fi-based systems now miss a significant chunk of visitors, and the miss rate isn't consistent — it varies by time of day, demographic, and device type. That makes the data unreliable in exactly the ways that matter for conversion rate calculations.
POS-Only Analysis
Some retailers try to infer conversion from POS data alone — looking at transaction patterns, basket sizes, and time-of-day trends. It's creative, and it's free if you already have the POS. But it's also fundamentally limited. You're seeing purchases without context. You can't calculate a conversion rate if you don't know how many people didn't buy. Period.
Thermal People Counters
A newer category that's gained traction, particularly among mid-market retailers. Thermal sensors detect body heat to count people entering and exiting, without capturing any visual data — no faces, no images, no personally identifiable information whatsoever. The better thermal counters now use machine learning to approach camera-level accuracy (distinguishing between adults and children, filtering out staff re-entries, handling groups walking in together) without the privacy baggage.
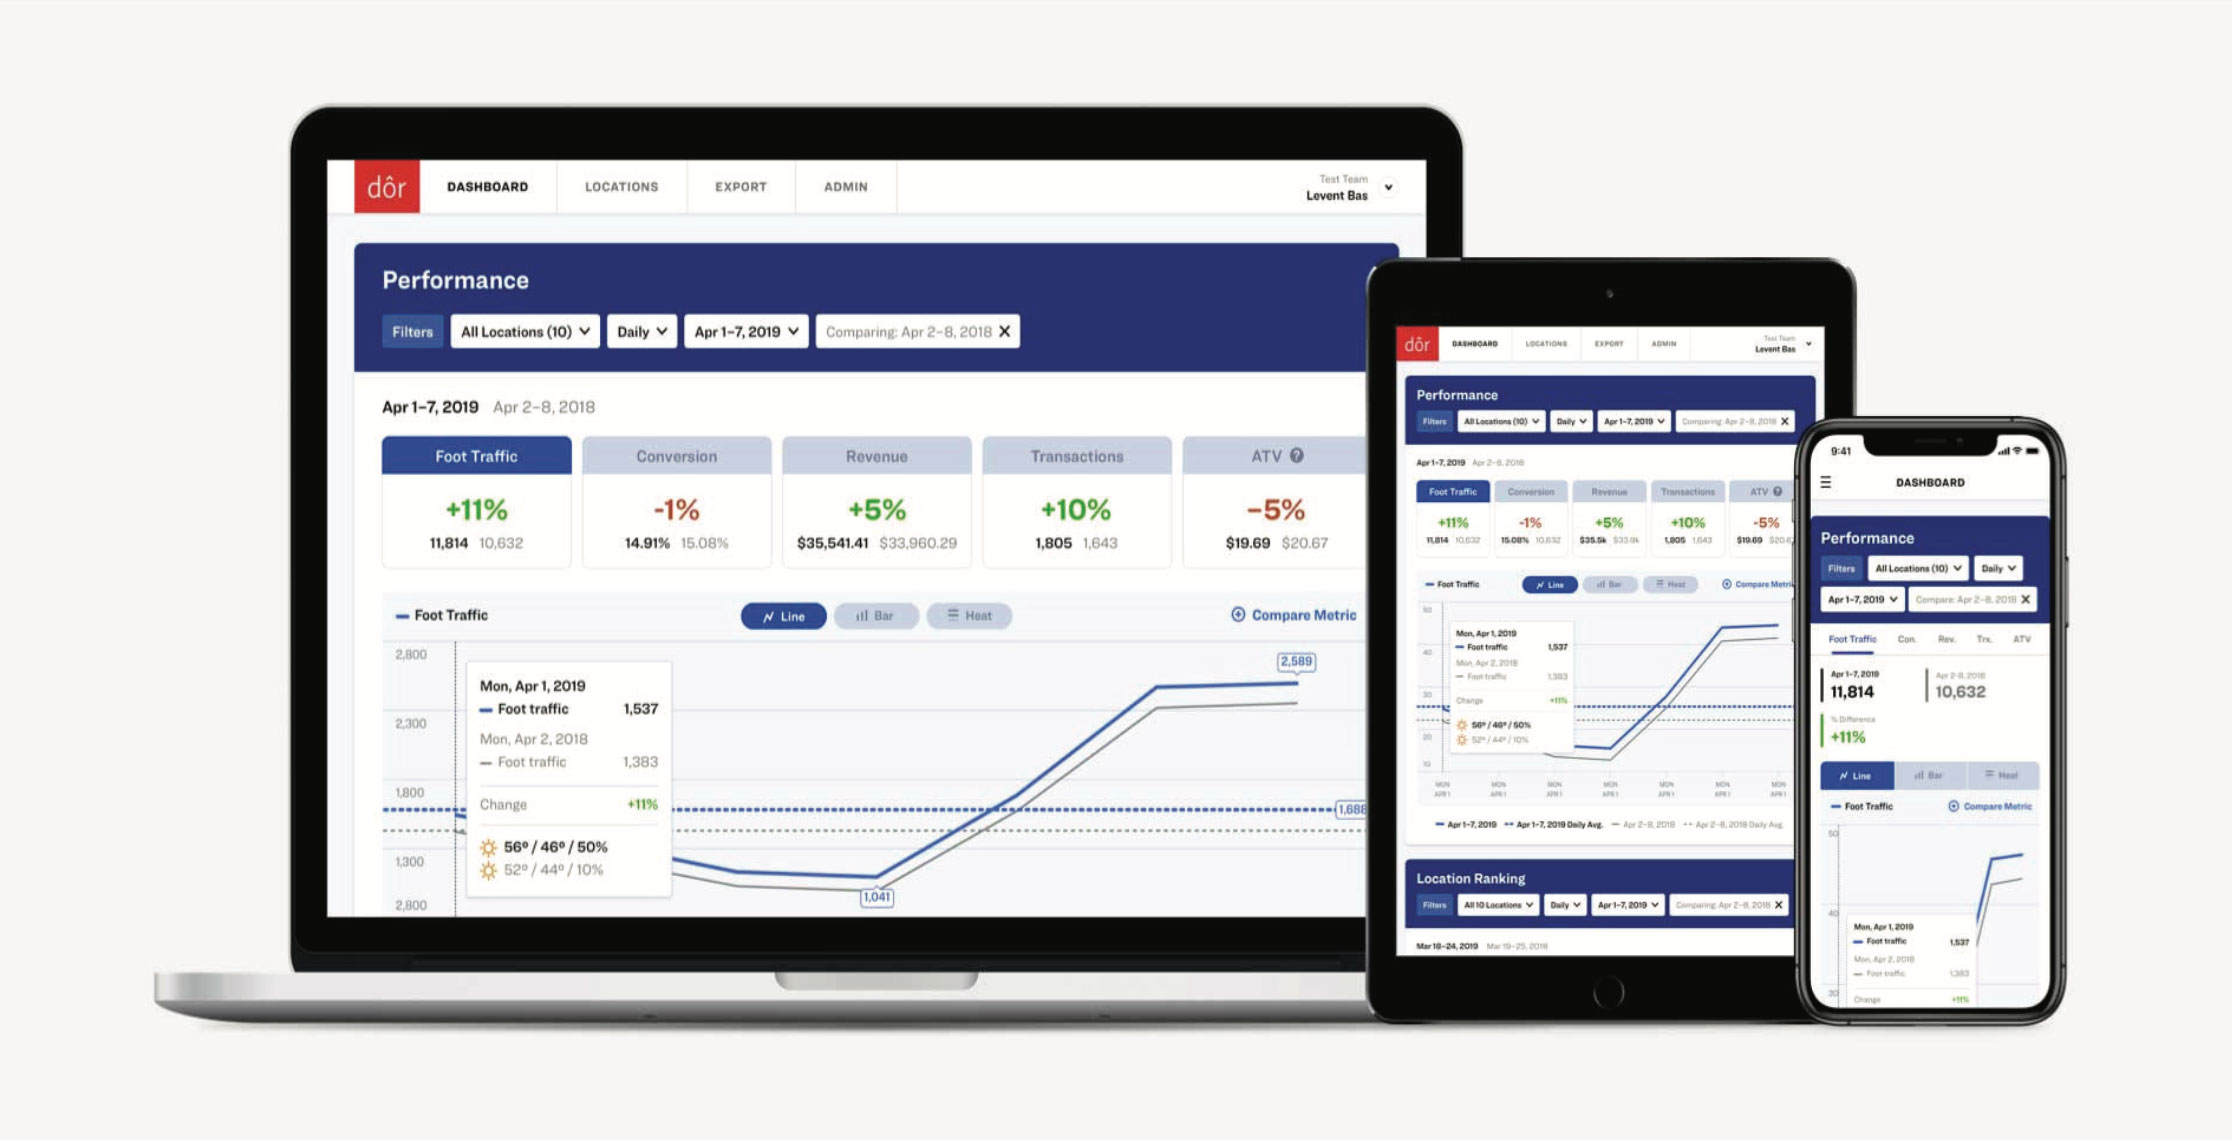
Dor, for example, makes a battery-operated thermal people counter that sticks to the door frame — no wires, no Wi-Fi dependency, no IT involvement. It integrates directly with POS systems, so your store conversion rate calculates automatically on a dashboard alongside foot traffic trends, revenue, transaction counts, and average transaction value. They've deployed in over 2,000 retail stores, and the peel-and-stick install means a store manager can set it up during a slow afternoon without calling anyone.
That's a meaningful shift from even five years ago, when accurate foot traffic analytics required a $10,000+ camera installation and a three-week IT project.
What to Do Once You Have the Data
Measuring your conversion rate is step one. The payoff comes from acting on it. Here are the three highest-impact areas where retail analytics consistently move the needle.
Fix Your Staffing Schedule
This is almost always the biggest quick win. Once you can overlay foot traffic data on your staffing schedule, mismatches become painfully obvious. Maybe you've been scheduling your strongest closer on Tuesday mornings (when traffic averages 14 visitors per hour) instead of Thursday evenings (when it spikes to 53). Maybe you've got four people on the floor at 10 AM because "that's how we've always done it," even though the data shows traffic doesn't pick up until 11:30.
One multi-location retailer we're aware of found that simply reallocating existing labor hours — not adding any — based on traffic patterns improved conversion by 2.8 points across their fleet. No new hires. No overtime. Just putting the right people in the right place at the right time.
Measure Marketing Where It Matters
Forget impressions. Forget click-through rates. The question that matters for brick-and-mortar marketing is simple: did more people show up?
Foot traffic data lets you draw a straight line between a campaign and its real-world impact. You ran a local Instagram ad on Thursday, and foot traffic was up 22% on Friday and Saturday versus the prior two weekends? That's signal. You sent an email blast about a weekend sale, and traffic was flat? That's signal too — the kind that saves you from doubling down on a tactic that isn't working.
This is where that 47% of unjustifiable marketing spend starts getting justifiable — or getting cut. Both outcomes make you smarter and more profitable.
Test Layout and Merchandising Changes
Retail is full of conventional wisdom that may or may not apply to your specific store. Does moving the sale rack to the back increase time-in-store and conversion, or does it just annoy people? Does the "speed table" near the entrance drive impulse buys, or does it create a bottleneck that pushes people away?
Without conversion data, you're debating opinions in a staff meeting. With it, you're running experiments. Move the display on Monday, watch the conversion rate for two weeks, compare it to the prior two weeks. The data doesn't lie, and it doesn't have a favorite theory.
Even small environmental changes show up in conversion data when you have enough traffic to be statistically meaningful. We've seen stores discover that something as simple as propping the front door open on warm days increased both foot traffic and conversion — people who might have kept walking were more likely to drift in, and the open-door feeling reduced the psychological commitment of entering.
Getting Started: Practical Next Steps
If you're among the 91% not tracking conversion, here's a realistic path to getting started — no six-figure capital project required.
Step 1: Establish Your Baseline
You need at least 30 days of foot traffic data before you can make meaningful decisions. Resist the urge to change anything during this period. You're gathering the "before" picture. Track daily traffic, hourly patterns, day-of-week variation, and your resulting conversion rates. You'll almost certainly be surprised by something — maybe Thursday outperforms Saturday, or maybe your lunch-hour traffic is twice what you assumed.
Step 2: Identify Your Biggest Gap
Look at your data through three lenses:
- Staffing alignment: Where are you overstaffed relative to traffic? Understaffed?
- Conversion variation: Which hours, days, or weeks show unusually high or low conversion? Why?
- Traffic sources: Can you correlate traffic spikes to specific marketing activities, weather, local events, or competitor behavior?
The biggest gap is your biggest opportunity. Start there.
Step 3: Make One Change at a Time
Resist the temptation to overhaul everything at once. If you change your staffing, your layout, and your greeting script simultaneously, you won't know which one moved the needle. Disciplined testing — one variable, measured against your baseline — compounds into serious improvements over a quarter or two.
Step 4: Scale What Works
For multi-location operators, this is where the math gets exciting. A tactic that lifts conversion by 1.5 points in your pilot store can be rolled across 15 or 50 locations. The incremental revenue scales linearly. The effort to implement it doesn't.
Getting the traffic data itself has gotten dramatically easier and cheaper than it was even three or four years ago. Solutions like Dor's thermal people counter can be up and running in under an hour, with no technical expertise required and no privacy concerns to navigate. The POS integration means you're not exporting spreadsheets and doing manual math — your conversion rate just shows up on a dashboard, updated daily, alongside the rest of your retail analytics.
The Bottom Line
Your store conversion rate isn't a vanity metric. It's the connective tissue between your marketing, your operations, and your revenue. It tells you whether more people are showing up (a marketing problem) or whether you're failing to convert the people who do (an operations problem). Those are fundamentally different challenges that require fundamentally different solutions.
Every retailer tracks sales. The ones pulling ahead are tracking the opportunity — the total number of people who walked in and could have bought something. That gap between traffic and transactions is where your next phase of growth lives.
Start measuring it. The rest follows.
Ready to see your store's real conversion rate? Try Dor's people counter free for 30 days — installs in minutes, no contracts, no cameras, no IT required.