Most retailers can tell you their revenue to the penny. They know average transaction value, units per transaction, and gross margin by category. But ask how many people walked into the store and left without buying, and the room goes quiet.
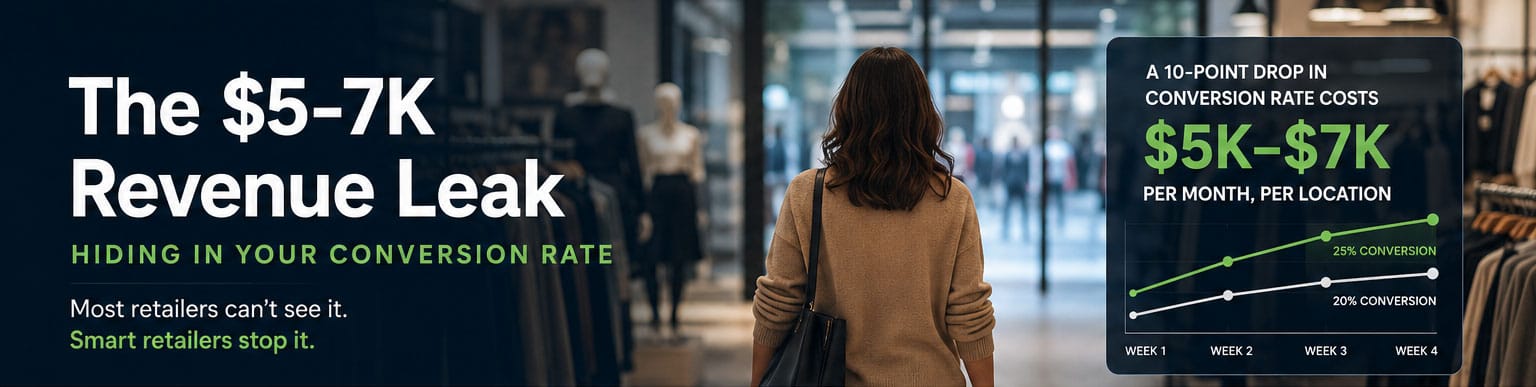
That gap between what you track and what you don't is where retail revenue leakage lives. For a typical independent retailer, a 10-point drop in conversion rate quietly costs $5,000 to $7,000 per month, per location. And because most stores never measure conversion in the first place, the leak runs indefinitely.
The Math Most Operators Never Do
Here's a straightforward example. Say your store averages 3,000 visitors per month and a 25% conversion rate. That's 750 transactions. If your average transaction value is $65, you're doing about $48,750 in monthly revenue.
Now imagine your conversion rate slips to 20%. Same traffic, same products, same hours. But transactions drop to 600. Monthly revenue falls to $39,000.
That's a $9,750 gap from a five-point conversion shift, and the only thing that changed was the percentage of visitors who actually bought something.
Scale it down to a more modest scenario. A three-point drop, from 25% to 22%, costs roughly $5,850 per month at that same traffic level and transaction value. This is where the $5-7K range comes from, and it's conservative.
The alarming part: 91% of clothing retailers don't know their conversion rate. They literally can't see the leak.
Why the Leak Stays Hidden
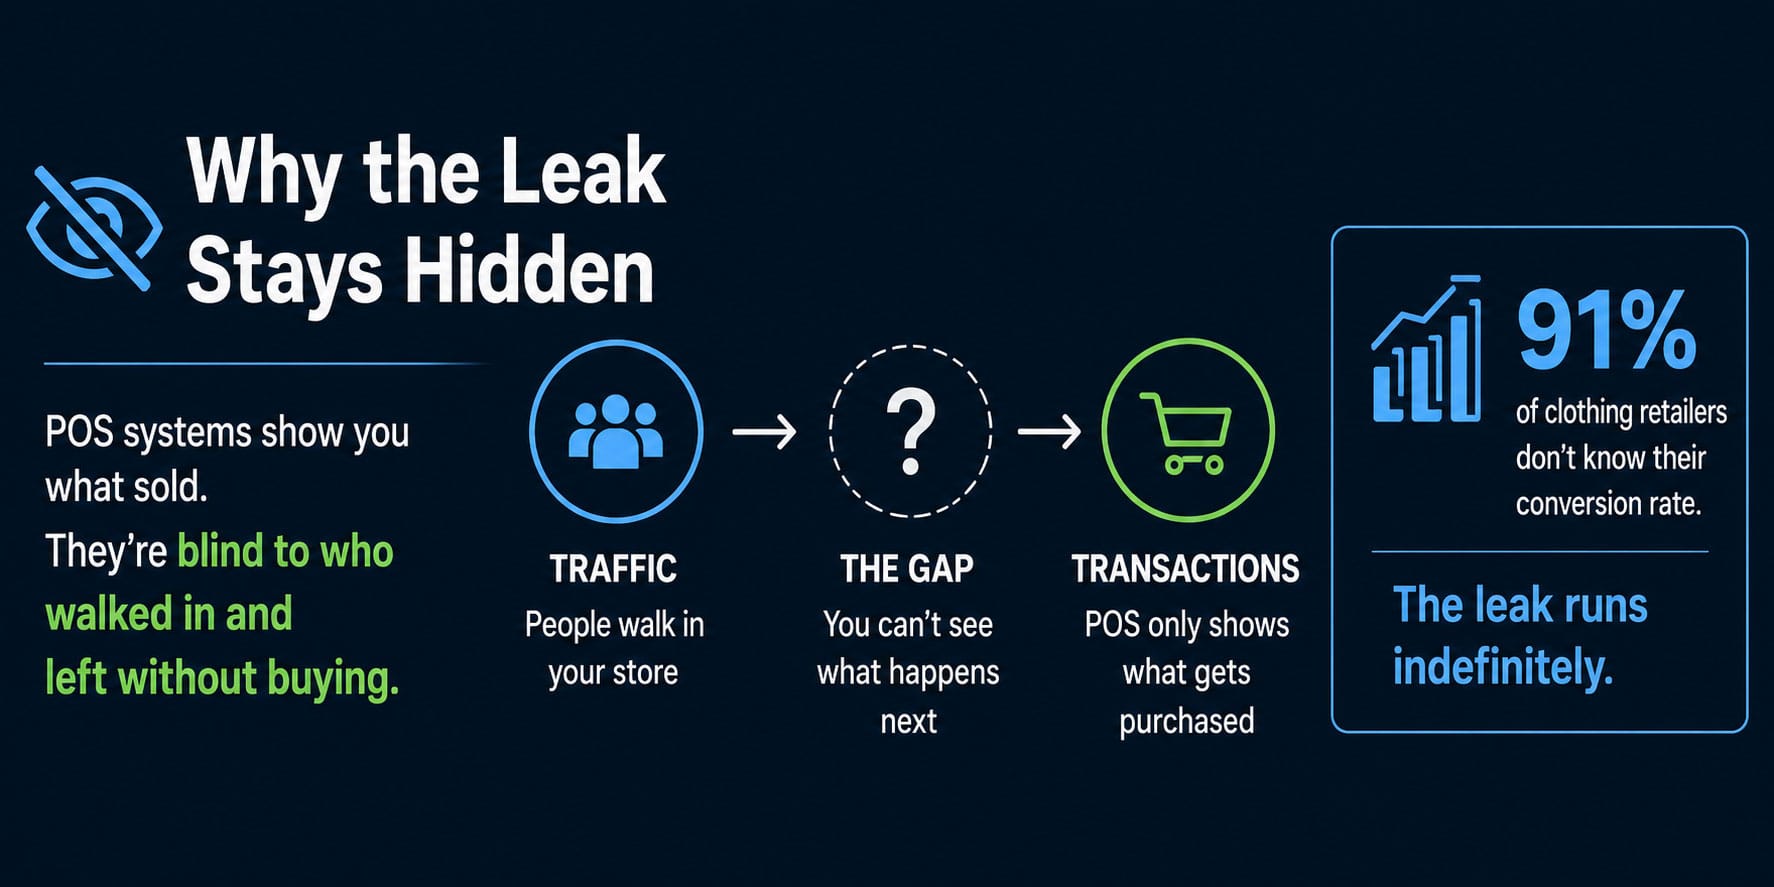
POS systems are brilliant at telling you what sold. They're completely blind to what didn't sell and why. When revenue dips, the default assumption is "slow week" or "weather" or "the economy." Sometimes that's true. But just as often, the traffic was fine and the store simply converted fewer of those visitors into buyers.
Without foot traffic data, you can't distinguish between these two scenarios. And each one demands a completely different response. Low traffic is a marketing problem. Low conversion is an operations problem: staffing gaps, merchandising misses, or service breakdowns.
Retailers who track both metrics consistently report catching issues weeks earlier than those relying on POS data alone. A conversion dip shows up in the data long before it shows up in your monthly P&L, giving you time to intervene instead of react.
Where the Revenue Actually Goes
Conversion rate leaks tend to cluster around a few predictable patterns.
Staffing mismatches. Only 36% of frontline retail associates say staffing schedules consistently align with actual store traffic. Peak hours without enough floor coverage mean customers who came ready to buy can't get help and leave. Even one missed sale per peak hour adds up fast across a month.
Invisible marketing waste. Research shows 47% of retail marketing spend is difficult to justify without traffic data. A campaign drives 200 extra visitors, but they convert at 8% instead of your usual 22%. That's 16 transactions from 200 people. The marketing looked successful because revenue went up slightly, but the conversion rate tells you those visitors weren't the right audience.
The slow Tuesday problem. Stores often cut staff on historically slow days without checking whether traffic is actually down or whether conversion just drops because there aren't enough people on the floor. In many cases, Tuesday isn't slow because nobody comes in. It's slow because nobody's there to help the people who do.
The Compounding Effect Across Locations
For multi-location operators, the math compounds quickly. A $5K monthly leak across 10 locations is $50,000 per month, or $600,000 per year. Even if only three of your ten stores have a conversion problem, that's still $180K annually in revenue you could capture without driving a single additional visitor through the door.
The frustrating reality is that most multi-location retailers have wide variance in conversion rates across stores but no visibility into it. One location might convert at 28% while another, with similar traffic, converts at 17%. That gap represents real revenue, and identifying it is the first step to closing it.
What Closing the Leak Actually Looks Like
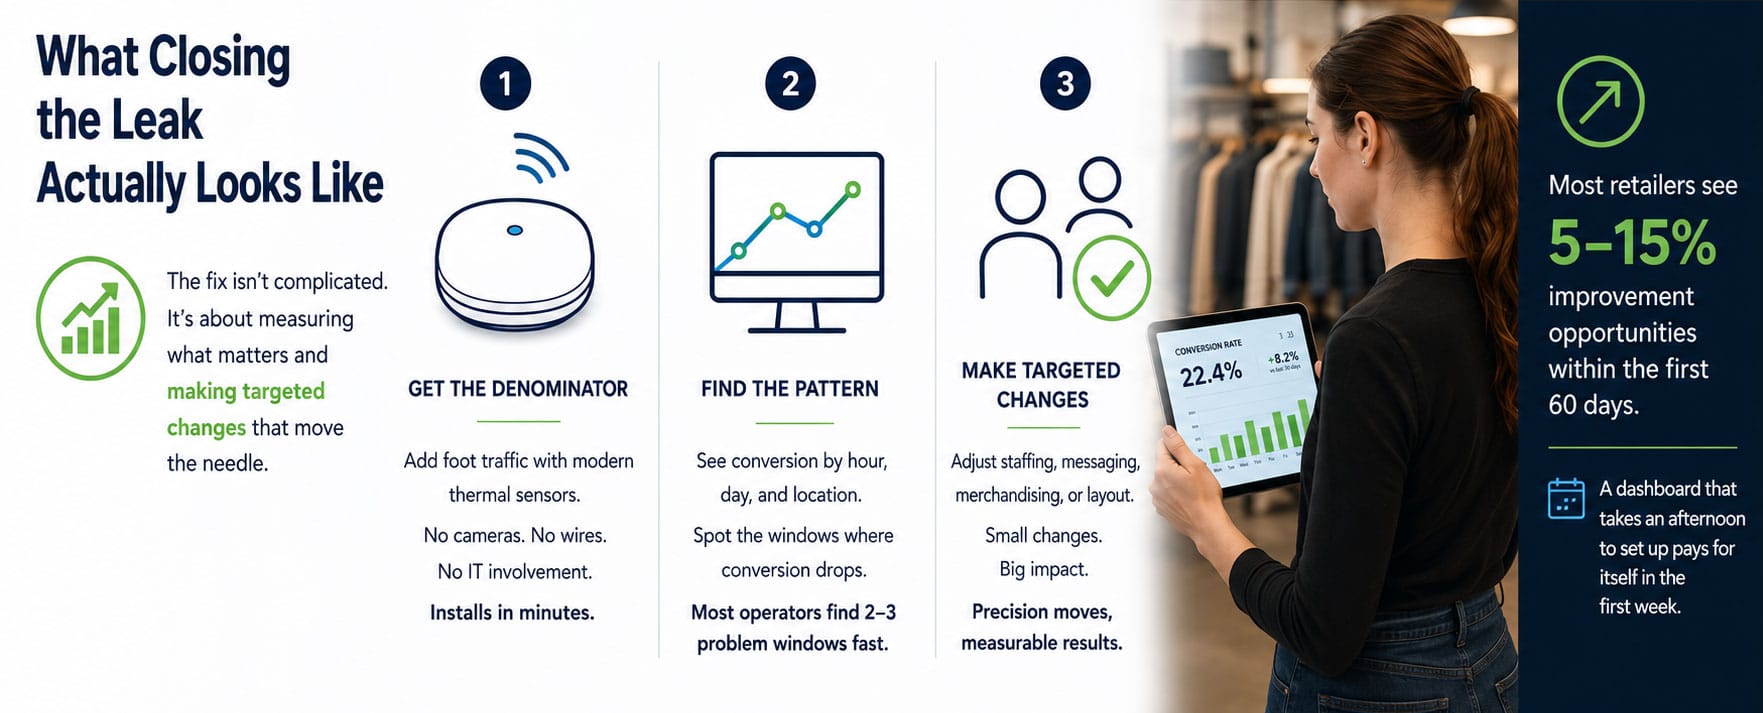
The fix isn't complicated, but it does require one thing most stores don't have: the ability to measure conversion rate consistently.
Step one: get the denominator. You already have transaction counts from your POS. You need foot traffic to complete the equation. Modern thermal sensors deliver camera-level accuracy without cameras, wires, or IT involvement, and they install in minutes.
Step two: find the pattern. Once you can see conversion by hour, by day, and by location, the patterns reveal themselves fast. Most operators discover two or three specific windows where conversion drops, almost always tied to staffing or scheduling.
Step three: make targeted changes. Shift one associate to the floor during a low-conversion peak hour. Adjust a marketing campaign that's driving low-quality traffic. Rearrange a display that's creating a bottleneck. These aren't sweeping overhauls. They're precise adjustments based on data you can now actually see.
Retailers who start tracking conversion typically find 5-15% improvement opportunities within the first 60 days, often from changes that cost nothing to implement. A conversion rate dashboard that takes an afternoon to set up pays for itself in the first week.
The Real Cost of Not Knowing
Revenue leakage from conversion rate drops isn't dramatic. There's no single moment where $7,000 walks out the door. It's a hundred missed $70 sales across a month, each one invisible because you never knew the customer was there.
That's what makes it dangerous. The leak is silent, steady, and entirely fixable once you can see it.
If you're running a retail operation and you don't know your conversion rate, the question isn't whether you have a revenue leak. It's how big it is.