Improving your retail store’s performance is like trying to hit an archery target on a windy day. You’re focused on your goal, but several variables impact your chances of achieving it – and those variables keep changing.
To increase your odds of success, you must keep adjusting your strategy while keeping your eyes fixed on the prize.
Retail KPIs Tell the Story
Before you can improve your retail store’s sales or customer base, or meet another growth target, you need an accurate picture of the current situation. That’s where KPIs, or Key Performance Indicators, enter the picture. Each of these key metrics provides an objective measurement of some aspect of your store’s performance.
Whether you’re a growing independent store or a large-scale enterprise retailer, closely monitoring your KPIs enables you to gauge your store’s health in numerous areas. Just note that some KPIs will carry more importance than others, based on your store’s operational parameters and the results you want to achieve.
Why Should You Measure the Key Metrics in Your Retail Business?
Monitoring your store’s KPIs will require ongoing effort and commitment, but the potential benefits are well worth it.
First, your carefully compiled data will identify emerging issues that deserve your attention. If you react quickly, you might be able to “tweak” your way to a solution before the issue becomes a full-fledged crisis requiring an “all hands on deck” management response.
When you identify a KPI that’s going in the wrong direction, reacting promptly can minimize the trend’s negative financial effects. In other words, you can catch the problem before your trickling losses become a torrent of cash flowing out of your business.
Finally, remember that your retail store doesn’t operate in a vacuum. In most cases, you’re surrounded by competitors who all want a bigger slice of sales or market share.
To retain (or improve) your store’s competitive position, monitoring your KPIs isn’t optional – it’s absolutely essential.
Finding the Most Relevant Retail KPIs
To determine the most relevant KPIs, choose measurable indicators that reflect the business’ strategic direction and can be monitored within a specific time period. If your larger retail operation has multiple departments, note that each business unit can designate targeted KPIs tailored to its own needs.
For example, your inventory manager may focus on stock turn data while your sales manager maintains an eagle eye on the sales per employee numbers. At the same time, your marketing team can focus on customer acquisition costs.
Looking at the big picture, small improvements in each area can lead to overall growth over time.
How Often Should You Monitor Your Retail Business’ Key Metrics?
You know that monitoring your retail store’s KPIs makes good business sense. Now, here’s the million-dollar question: how often should you do it?
There isn’t a one-size-fits-all answer, as each KPI is designed to measure a specific aspect of store operations.
For example, measuring sales per square foot and sales per employee monthly enables you to identify trends and make relatively quick adjustments. On the other hand, monitoring your stock turn rates seasonally and yearly makes sense.
Foot traffic is a different animal. Reviewing weekly, monthly, or even yearly data can indicate upward or downward swings in your store’s business.
15 KPIs to Measure in Your Retail Business
Now that you know the basics of retail KPIs, let’s look at the specific metrics you should track. Here are the top 15 key performance indicators to watch in your business.
➣ Foot Traffic
Diving deeper into foot traffic is beneficial, as this important KPI sets the stage for numerous sales-related metrics inside the store.
Maintaining an ongoing tally of foot traffic, or customers who actually walk through your door, helps you to gauge your marketing and advertising campaigns’ effectiveness.
Door traffic can also provide clues on your window displays’ appeal.
• How to measure your foot traffic
The most effective way to measure foot traffic is to use people counters such as thermal sensors, video cameras, breakbeams, WiFi, or Bluetooth Beacons.
The right foot traffic solution depends on your needs, and you should consider factors such as the cost of the solution, the implementation process, and the types of data that you can extract. The best people counting solutions are the ones that deliver tremendous insights while still remaining cost-effective.
Related: 17 Questions to Ask Before Purchasing a People Counter
Dor, for example, not only surfaces visitors counts and foot traffic data, but it can also integrate with your point of sale system so you can calculate your conversion rate and identify sales trends in your business.
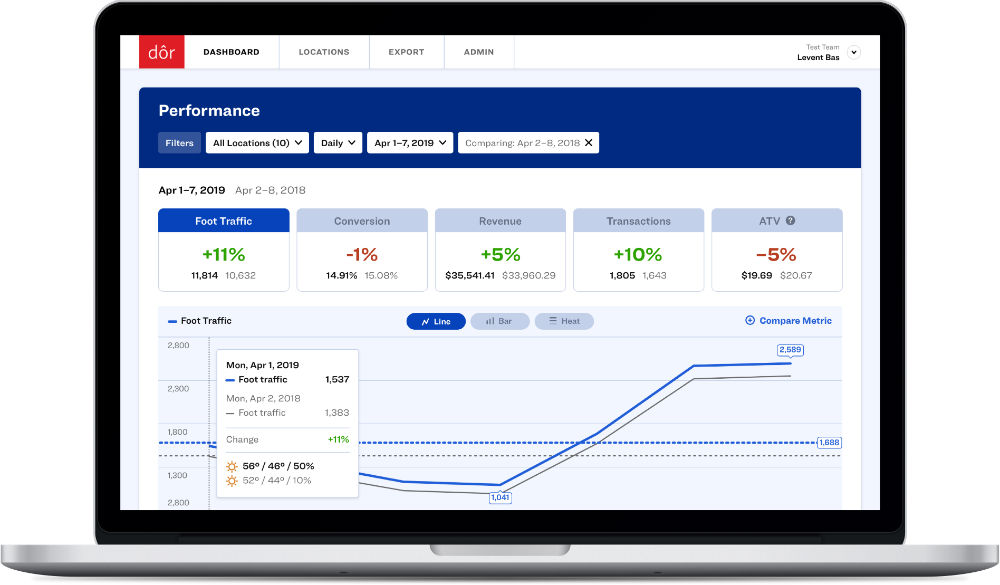
Click here to discover how a people counting solution like Dor can help you make better business decisions based on your store's foot traffic data.
Ready to purchase? Complete your purchase in just minutes!
• How to improve your foot traffic
There are many ways to improve your store’s foot traffic. One low-hanging fruit is to revamp your store’s display windows, with the goal of enticing more shoppers inside.
Next, build relationships with your customers (and prospects) through eNewsletters, social media campaigns, and other online venues. Through these ongoing contacts, shoppers will be encouraged to keep your store “top of mind” when searching for products they want.
➣ Units per Transaction
Your store’s Units per Transaction (also known as Average Items per Transaction) is one of retail’s most important key metrics.
It shows the average number of items customers buy in a specific transaction. A higher Units per Transaction (UPT) means customers are piling more items in their carts during each visit.
This desirable outcome means customers are enjoying their shopping experience, and are staying long enough to buy more items than they initially intended. It’s also an indicator that your store understands its customer base, and offers products that shoppers value.
In some cases, your UPT could shed light on how effective your sales techniques are. When people are buying more items per visit, it could indicate that your associates are doing a great job at cross-selling and product recommendations.
Related: 5 retail associate skills to boost in-store conversions
• How to measure units per transaction
Finding the Units per Transaction requires a simple calculation:
Units per Transaction = Total Number of Items Bought / Number of Transactions
Example: If a retail store sold a total of 342 items and processed 119 transactions in a given month, then the business would calculate its UPT of the month as follows:
342 / 119 = 2.87 units per transaction
• How to improve units per transaction
To raise this KPI, set the stage for customers to purchase additional items during a single shopping trip.
Place add-on products near items that customers are likely to purchase. If it’s economically feasible, add more color and/or style choices to a popular clothing line. Consider incentive pricing that may spur customers to buy multiples of a specific product.

➣ Sales per Employee
Tracking your retail store’s Sales per Employee gives you a running snapshot of your sales associates’ performance. This data can help you in planning work schedules and sales incentives.
Over time, you’ll notice opportunities for training and individual recognition.
• How to measure sales per employee
Track your sales per employee with this simple formula:
Sales per Employee = Net Sales / Number of Employees
Example: If a retailer has 4 employees and a net sales of $11,500 then its sales per employee would be:
$11,500 / 4 = $2,875 per employee
If you have a POS system that gives each employee a sign-in code, you can easily track that associate’s daily, weekly, and monthly sales. By gathering that data, you’ll gain clues to your employees’ overall performance.
• How to improve sales per employee
Although there’s no universal solution to getting your employees to sell more products, setting individual goals for each associate is a good start.
Create an incentive system that will motivate employees to up their games. Providing relevant sales training through videos and role-playing may also be helpful.
Related: 9 Practical Ideas to Improve Retail Employee Performance and Sales
➣ Sales per Square Foot
Sales per square foot is exactly what it sounds like: it’s a measure of the revenue generated per square foot of sales space in your store.
To grasp this KPI’s full impact, think of your store’s sales floor as a powerful engine that drives the business’ success. For the engine to run at maximum efficiency, every square foot of sales space must pull its weight, or generate enough revenue to enable you to meet preset operational goals.
• How to measure sales per square foot
Maximizing your Sales per Square Foot means earning the highest possible revenue from each square foot of sales space. Here’s the simple formula:
Sales per Square Foot = Net Sales / Total Sales Floor Space
Example: A store with 2,100 square feet of selling space and net sales of $155,000 would have the following calculation:
$155,000 / 2,100 = $73.80 per square foot
• How to improve sales per square foot
To beef up your numbers, examine the weekly, monthly, quarterly, and yearly trends for each product or sales floor segment. When you find underperforming products or product classes, revamp your displays and retool your marketing and advertising programs.
Consider moving those lagging products to another part of the sales floor, as customers could be ignoring them in their current location. If you’ve made all those moves and your efforts haven’t paid off, hold a blowout sale to help cut your losses.
During your next store redesign, introduce products that may better resonate with your customers.
➣ Conversion Rate
Whether you're a small business or an enterprise, your retail conversion rate is a key metric to track.
It measures the proportion of shoppers’ store visits compared to the number of shoppers who actually bought something. This number shows your store’s skill at turning casual browsers into buyers who will bring in valuable sales dollars.
• How to measure your conversion rate
Calculating your store’s conversion rate is a straightforward exercise:
Conversion Rate = Number of Sales / Total Number of Visitors x 100
Example: A store that attracts 320 guests and converts 111 of them into paying customers would have the following calculation:
111 / 320 x 100 = 34% conversion rate
• How to improve your conversion rate
Your employees can help you to turn browsing shoppers into paying customers. First, provide your associates with relevant product collateral, as that enables them to provide information and value.
Next, encourage employees to establish a rapport with customers, and talk about products’ advantages without becoming pushy and aggressive. Engage your team in role-playing exercises that will help them to increase their comfort level.
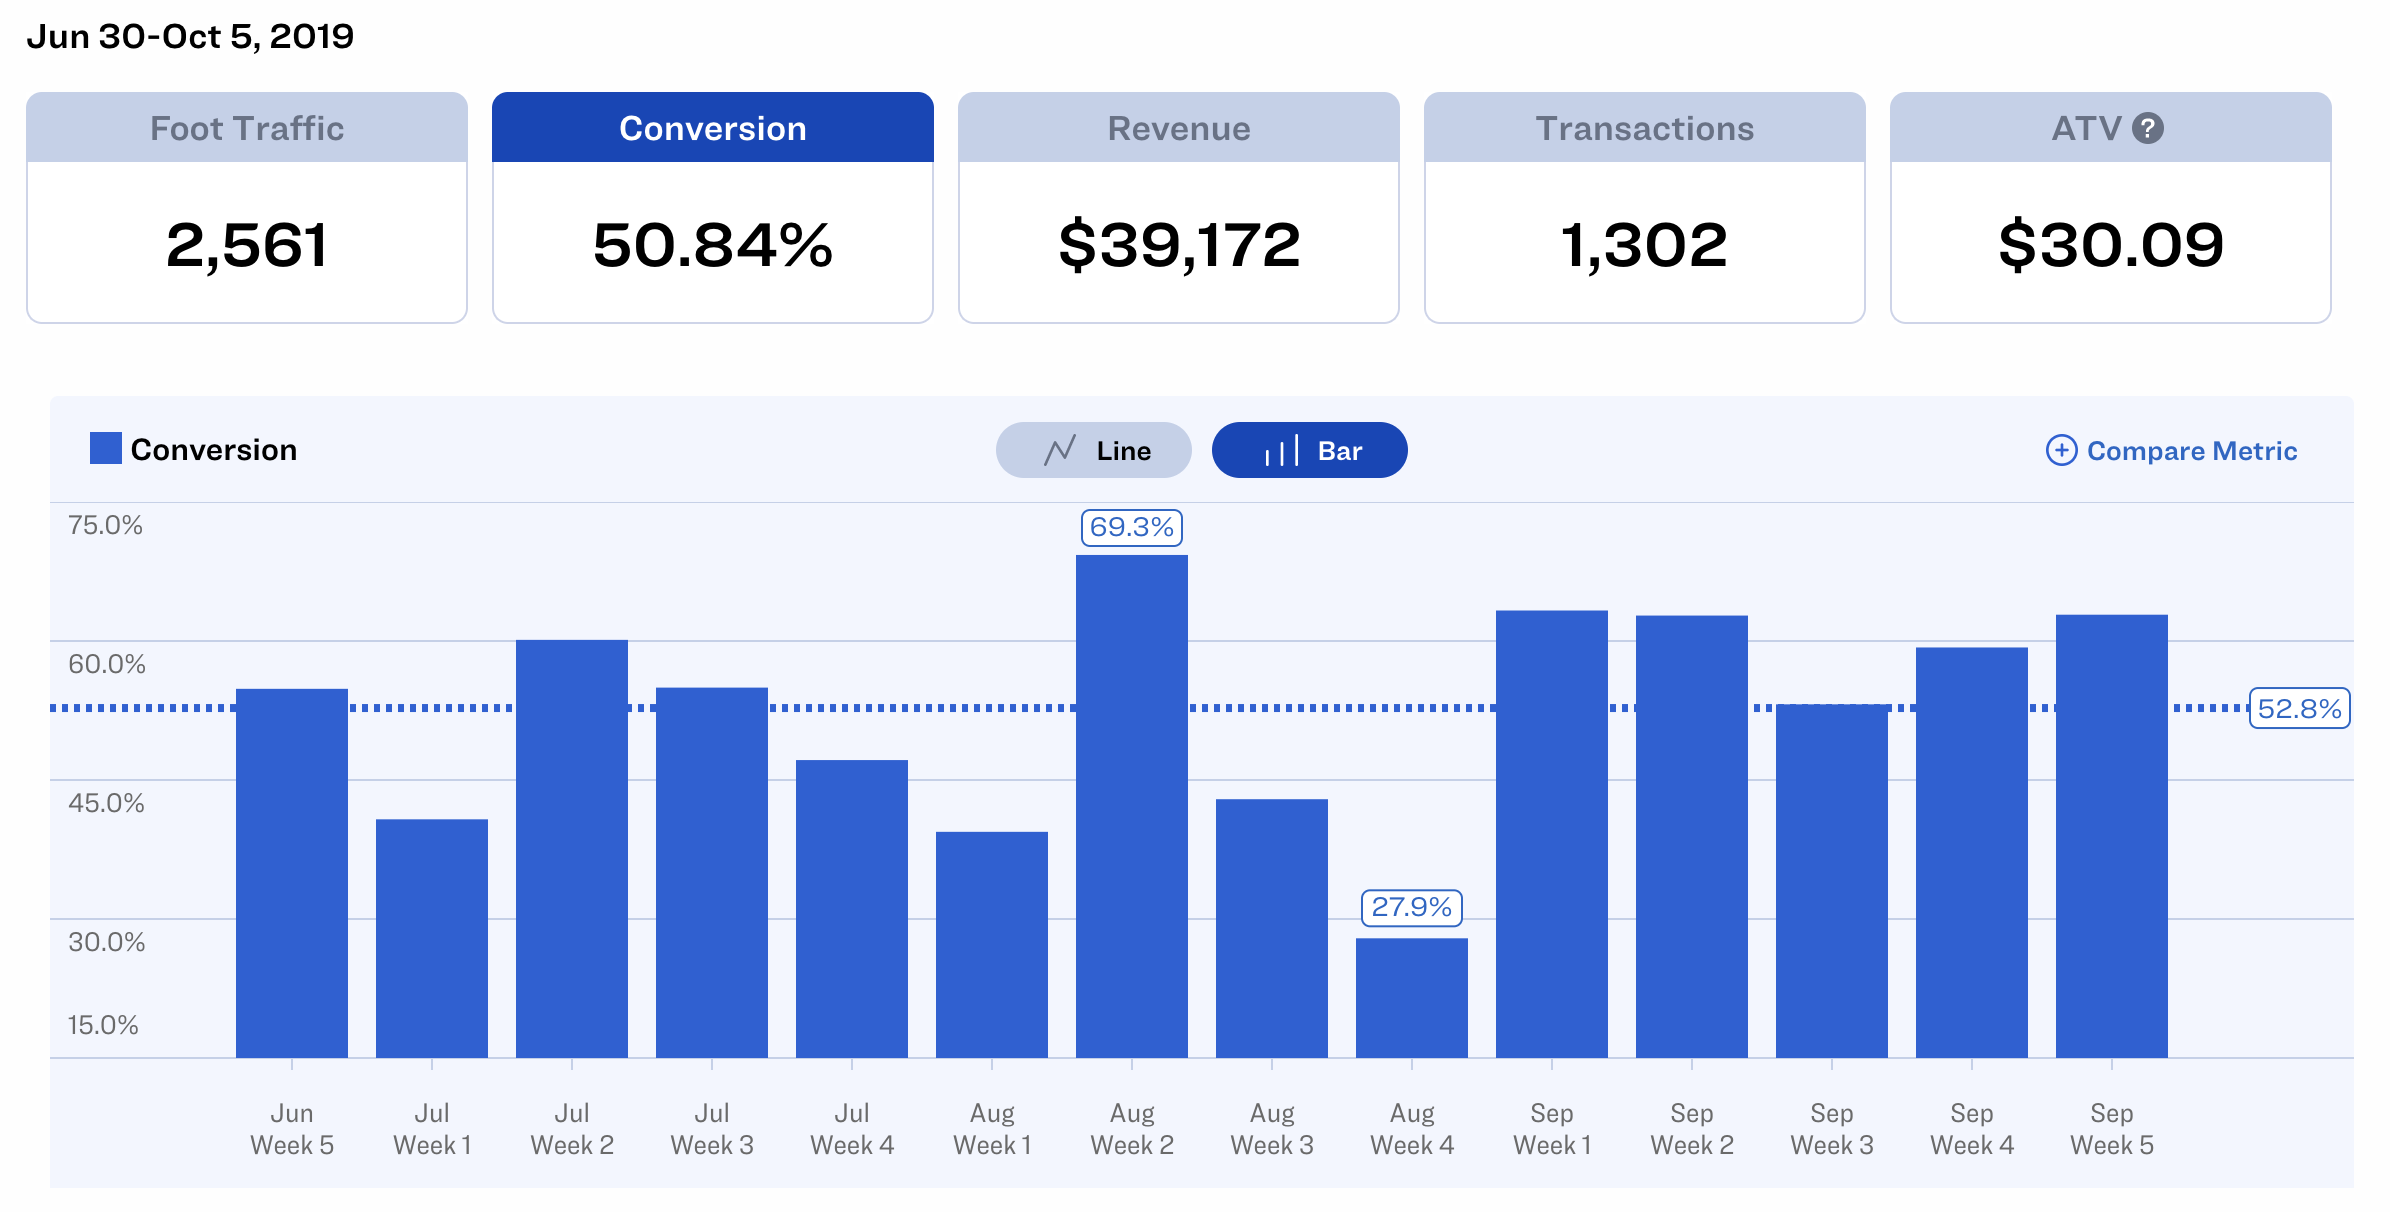
Click here to discover how a people counting solution like Dor can help you understand your conversion rates based on your store's foot traffic data.
Ready to purchase? Complete your purchase in just minutes!
➣ Gross Profit & Net Profit
If you’ve ever taken an Accounting 101 class, you’ll remember that gross profit and net profit are key metrics for every business.
Your gross profit shows your income after subtracting the expenses involved in producing and selling your products.
Your net profit includes those expenses, along with your business operations expenses. Examples include administrative costs, utilities, insurance, and others.
Related: 7 Proven and Working Ways to Increase Profit Margins in Retail
Taken together, your gross profit and net profit will show whether your business is making any money. It’s possible to have good sales and revenue numbers, but to be so burdened by expenses that you realize little (if any) profit.
By closely monitoring both of these important KPIs, you’ll get an indication of where to cut expenses and change your operational procedures.
• How to measure gross profit and net profit
Your gross profit only considers your total product sales, less the cost of creating and selling your products. Find gross profit with this simple formula:
Gross Profit = Sales Revenues – Cost of Goods Sold
Example: If a store purchases a product for $10 and sells it for $25 then its gross profit calculation would look like:
$25 - $10 = $15
Your net profit subtracts your cost of goods sold, plus all your business operations costs, from your revenues. Use this calculation to find net profit:
Net Profit = All Revenues – All Expenses
Example: If a business brings in $77,900 in revenues and spends $35,300 in operating costs, inventory, staffing, and other expenses, its net profit calculation would be:
$77,900 - $35,300 = $42,600
• How to improve gross profit and net profit
To increase your retail store’s profits, consider raising your prices (but evaluate the potential pitfalls of this tactic). Decrease your operating expenses across the board. Build “win-win” relationships with your vendors, and fine-tune your purchasing procedures to get more bang for your buck.
➣ Year-over-Year Growth
When you launched your business venture, you visualized it growing and become even more successful. So, has that vision come to fruition?
Are you in a better financial and business position compared to previous years?
Measuring year-over-year growth can provide you with the answer. In a nutshell, you’ll compare your current year’s results against the same factors for the previous year. If you’ve experienced steady (or rapid) business growth, you’re clearly doing numerous things right. However, if your business growth has stalled lately, some retooling is probably needed.
• How to measure year-over-year growth
Use the following equation to determine your business’ year-over-year revenue growth:
Year-over-year Growth = (Current Period Revenue – Prior Period Revenue) / Prior Period Revenue x 100
Example: If a company earned $45,000 in its first year of business and then brought in $88,000 the following year, then its YoY growth calculation would be:
($88,000 - $45,000) / $45,000 x 100 = 95%
• How to improve year-over-year growth
Before you can get your business growth going in the right direction, you must first determine why it has slowed down or stalled. So, examine all the variables that can impact your business’ success.
First, note any subtle market changes (or large-scale market shifts) that have negatively impacted your company. Next, pinpoint external trends that could factor into your growth slowdown.
These might include more potential customers buying from online retailers, a less favorable economic climate, or a competitor’s new products that have eclipsed your offerings. Once you identify the offenders, create a plan to turn each area around, along with specific measurement criteria and timelines.
➣ Stock Turn / Inventory Turnover
In a nutshell, Stock Turn (or inventory turnover) refers to the number of times your collective inventory turns over (or sells) during a specific time period. By consistently monitoring this KPI, you can judge your sales strategies’ effects on the store’s longer-term profitability.
A low stock turn means you’re selling products too slowly, and waning customer interest can leave you stuck with unwanted inventory.
Conversely, a very rapid stock turn can mean you’re selling out of products too often, and don’t keep enough units in stock to meet customer demand.
• How to measure stock turn / inventory turnover
Closely monitoring your inventory’s stock turn will help you to maintain an adequate product inventory. Follow this simple formula:
Stock Turn = Cost of Goods Sold / Average Inventory
Example: If a store has a COGS of $200,000 and an average inventory of $50,000; its stock turn calculation would be:
$200,000 / $50,000 = 4
• How to improve stock turn / inventory turnover
Your improvement strategy will depend on your current situation. If your inventory doesn’t sell fast enough, revise your re-order procedures so you don’t keep too many products on hand. Offer super bargains to move out your languishing merchandise fast.
Maybe you’re at the opposite end of the spectrum, with excessively high stock turn leading to emptier shelves. Although that sounds like a desirable problem, ongoing stock shortages will quickly lead customers to shop elsewhere. Address this issue by tweaking your ordering procedures to keep more merchandise in stock.
➣ Sell-through Rate
Another one of those key metrics in retail, Sell-through Rate will indicate how well merchandise moves through your store. A specific product’s sell-through rate is the percentage of items sold compared to the number of items available for sale. Knowing a product’s sell-through rate enables you to revise your purchase decisions accordingly.
• How to measure the sell-through rate
Measuring a product’s sell-through rate is simple, and the result appears in percentage form:
Sell-through Rate = Number of Units Sold / Beginning Inventory x 100
Example: If a retailer stocked 250 widgets and sold 95 of them in a month, then its sell-through calculation would be:
95 / 250 x 100 = 38%
• How to improve the sell-through rate
Achieving a better sell-through rate requires a targeted strategy. For example, let’s say you sell 75 percent of a product’s available stock in less than a week, which is much faster than average. That indicates that demand is up, and you should order more products to avoid the dreaded “empty shelves” problem.
In contrast, a very slow sell-through rate requires an aggressive turnaround plan. Depending on your situation, a price cut or creative promotional idea could spur customers to pick up their buying pace.
➣ Gross Margin Return on Investment (GMROI)
Gross Margin Return on Investment (GMROI) measures the amount of profit you receive from the retail inventory you purchase. Essentially, this figure tells you whether your merchandise has turned a profit.
If the answer is “yes,” you’ll learn how many dollars you gained for every dollar of retail stock you bought. Obtaining the GMROI for a product category, or a specific product is useful in determining which items or merchandise classes are worth their purchase cost.
Generally speaking, you should measure GMROIs annually, with the goal of increasing the numbers every year.
• How to measure your GMROI
Obtain your GMROI using this simple formula:
GMROI = Gross Profit / Average Inventory
Example: If a business has a gross profit of $75,000 and an average inventory cost of $44,000. Its GMROI calculation would look like this:
$75,000 / $44,000 = $1.70
• How to improve your GMROI
To improve a specific GMROI, find ways to get more income from that product or category. If you can obtain special discounts, or otherwise decrease your cost of goods sold, that will help. Or, consider hiking your prices to potentially realize a higher profit. Of course, selling more of that item (e.g. increasing the item’s inventory turnover) is always beneficial.
➣ Average Transaction Value
If you want to determine how much each customer spends in your store, on average, the average transaction value will provide you with the answer. If it’s a high number, that customer is either buying multiples of one or more products, or they’re springing for a couple of higher-dollar items.
If the per-transaction number is on the low side, that could indicate an imbalance in your product mix or pricing structure. Or, maybe you haven’t implemented purchase incentives that might spur customers to raise their average spend.
• How to measure the average transaction value
Determining the average transaction value is the first step to increasing it. Here’s the straightforward formula:
Average Transaction Value = Total Revenue / Number of Transactions
Example: If a retail boutqiue brings in $150,000 in sales and processed 406 transactions, its ATV calculation would like this:
$150,000 / 406 = $369.45 ATV
If you’d like to compare your foot traffic to your customers’ average transaction value, you’re in luck. Dor’s retail analytics solution can place those numbers on your dashboard, giving you a ready reference that saves you valuable time.
Click here to discover how a people counting solution like Dor can help you understand your average transaction value based on your store's foot traffic data.
• How to increase the average transaction value
To raise the average transaction value, while not drastically changing your product mix, introduce (or increase) cross-selling or up-selling to your sales techniques. Before you jump in, however, create a “win-win” strategy that benefits both your store and the customers.
For example, a well-executed cross-selling display can entice the customer to buy accessories or add-ons to a product they already planned to purchase. Upselling is a bigger challenge.
In a nutshell, you want to recommend a higher-priced (and relevant) product that will provide the customer with value. However, you don’t want to become that “pushy salesperson” that could cause the entire purchase to turn sour. It’s important to find the right balance and work with your associates when executing upselling sales techniques.
➣ Customer Retention Rate
You regularly use advertising, promotional, and social media campaigns to get customers into your store. But, how many of them come back after their initial visit?
By calculating your Customer Retention Rate, you can begin to evaluate your products’ quality and effectiveness. This data also highlights your overall customer service performance, along with the customers’ loyalty to your store.
• How to measure your customer retention rate
Determine your customer retention rate with this formula from Inc.com:
Retention Rate = ((CE-CN)/CS)) X 100
CE = number of customers at the period’s end
CN = number of customers acquired during the period
CS = number of customers at the period’s start
Example: If a subscription-based business kicks off the month with 75 subscribers, acquires 50 more within the month, and has 109 subscribers by the end of the month, its retention rate calculation would look like this:
((109-50)/75)) x 100 = 78.66%
• How to improve your customer retention rate
Improving your customer relationships is the key to bettering your customer retention rate. To that end, provide coordinated customer service training for your entire staff.
Where applicable, provide personalized shopping assistance, and implement a top-notch customer loyalty program. To provide more reasons for customers to visit your store, build a community by offering classes, store events, and/or social media gathering spots.

➣ Shrinkage
Inventory shrinkage is an annoying aspect of any retail store operation. By definition, shrinkage means lost inventory that doesn’t result from sales. Although shoplifting and employee theft are frequently mentioned as causes, administrative mistakes and supplier errors (or fraud) can also be to blame. The end result is a negative impact on your bottom line.
• How to measure shrinkage
Identifying the scope of your shrinkage problem is key to addressing it. Here’s how to calculate that answer:
Shrinkage = Value of Inventory That’s Supposed to Be in Stock / Value of Physically Counted Inventory
Example: Let’s say a retailer is supposed to have $34,000 worth of stock. But after physically counting its merchandise, the store only has $32,500 in inventory. The store’s shrinkage calculation would be:
$34,000 / $32,500 = 1.04
• How to decrease shrinkage
Reducing your shrinkage rate requires a targeted approach. If shoplifting is running rampant, put better store security in place. If you suspect employee theft, enhance your employee screening techniques, and create more checks and balances that will discourage inside jobs.
To minimize administrative mistakes, revisit your training and ordering procedures. To ensure supplier accuracy, require line-item sign-off of every item you order (and receive) before paying your supplier invoices.
➣ Customer Acquisition Costs
Consistently bringing new customers to your store is key to its continued growth. However, you’ll incur a certain amount of money to acquire each customer. Known as the Customer Acquisition Cost (CAC), this figure includes the marketing, sales, and other expenses associated with bringing that customer into the business.
Whether it's social media marketing, email marketing or video marketing, customer acquisition costs have trended drastically upward in recent years, because of an increasingly competitive retail marketing landscape. That’s why it’s important to track this metric closely and find creative ways to acquire new customers without breaking the bank.
• How to measure your customer acquisition cost
By regularly monitoring your customer acquisition cost, you can make adjustments based on your marketing and advertising campaign results. Here’s the easy-to-use formula:
Customer Acquisition Cost = Marketing Costs / Customers Acquired
Example: If a store spent $4,000 to acquire 87 customers, then its CAC calculation would be:
$4,000 / 87 = $45.97
• How to lower your customer acquisition cost
To get your customer acquisition cost down, pinpoint your target audience, and retool your marketing and advertising campaigns accordingly. Create (or enhance) your brand awareness and referral programs, as those efforts can help you land more customers without additional expense.
Build a vibrant social media community that encourages users to share their product experiences. At the same time, provide them with helpful content that can enrich their quality of life.
Before moving forward, ensure that you have the resources to support your customer acquisition strategies over the long term. Build in some flexibility, as well-laid plans can go off the rails when unexpected issues arise.
➣ Comparable Store Sales
The term “Comparable Store Sales” is also known as "same store sales" and "comparable retail sales.” This KPI shows retail stores’ revenue generated in the most recent accounting period, compared to the revenue from a previous accounting period. This metric includes multiple company stores that have been in operation for more than a year.
In a nutshell, the Comparable Store Sales metric enables you to evaluate your retail stores’ performance after eliminating the chaos that affects newly opened or closed locations. The results will show a single store’s performance, as well as the retail chain’s aggregate results. For example, viewing two different holiday season’s sales figures can help you to detect changing retail trends.
• How to measure comparable store sales
To find your comparable store sales, use the following formula:
Comparable Store Sales = ((New sales / Old sales) -1) x 100
Example: If a retail chain earned $110 million in revenues in Q1 of the year, then proceeded to have a revenue of $112 million the following quarter, its comparable store sales would be calculated as follows:
((112 / 110) -1) x 100 = 1.81%
• How to improve comparable store sales
To boost your Comparable Store Sales, keep an eye on retail market trends so you can adapt to changing customer preferences. Keep your product quality high regardless of cost, as that variable greatly influences your customers’ shopping experiences.
Finally, focus on cultivating your customer base. Provide customers with value through special events and personalized offers, and build a strong social media presence that encourages a sense of community. Understand that these are “long haul” approaches that will require your ongoing support.
Final Words
Now that you’ve amassed an impressive retail metrics toolkit, determine the best way to consistently measure each applicable determinant. Purchase a retail tracking solution that performs those functions so you can spend your time interpreting the results and making needed enhancements.
Click here to discover how a people counting solution like Dor can help you have positive ROI based on your store's foot traffic data.
Hi there! If you liked this post, please feel free to share it on social media to help us reach out to more retailers like you. You can also leave a comment below and let us know if you have any questions!
Start counting your foot traffic now
Get data faster with the world’s first thermal-sensing, battery-operated people counter