Whether you run a small boutique or a multinational chain of stores, keeping abreast of key retail statistics should be an important part of your business.
Thanks to advanced technologies that provide us with increasingly sophisticated ways to collect and analyze data, we’re able to amass more retail stats than ever before to drive our stores toward greater success. However, if we want to survive in a competitive marketplace, it’s also important to know what’s going on in the world at large so we can set realistic retail benchmarks.
In this article, we will focus on recent retail stats from the United States and what they mean for specific industries. From holiday retail statistics to the rise of e-commerce and even worldwide retail benchmarks, we’ll share with you all the facts and figures you need to know to make the right choices for your business.
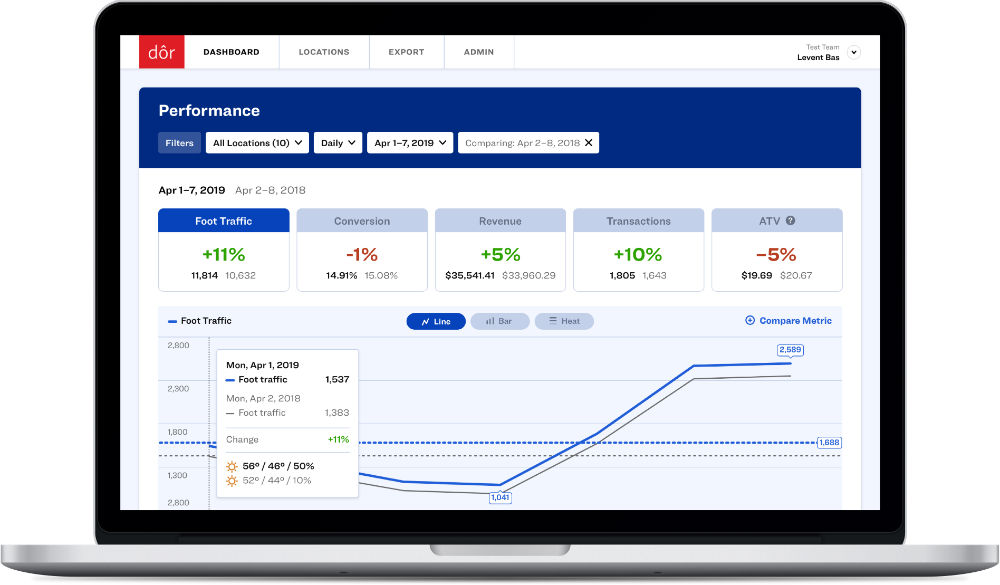
Click here to discover how a people counting solution like Dor can help you understand your foot traffic data and how to utilize it to make more profitable business decisions.
1- Year-over-year change in retail sales
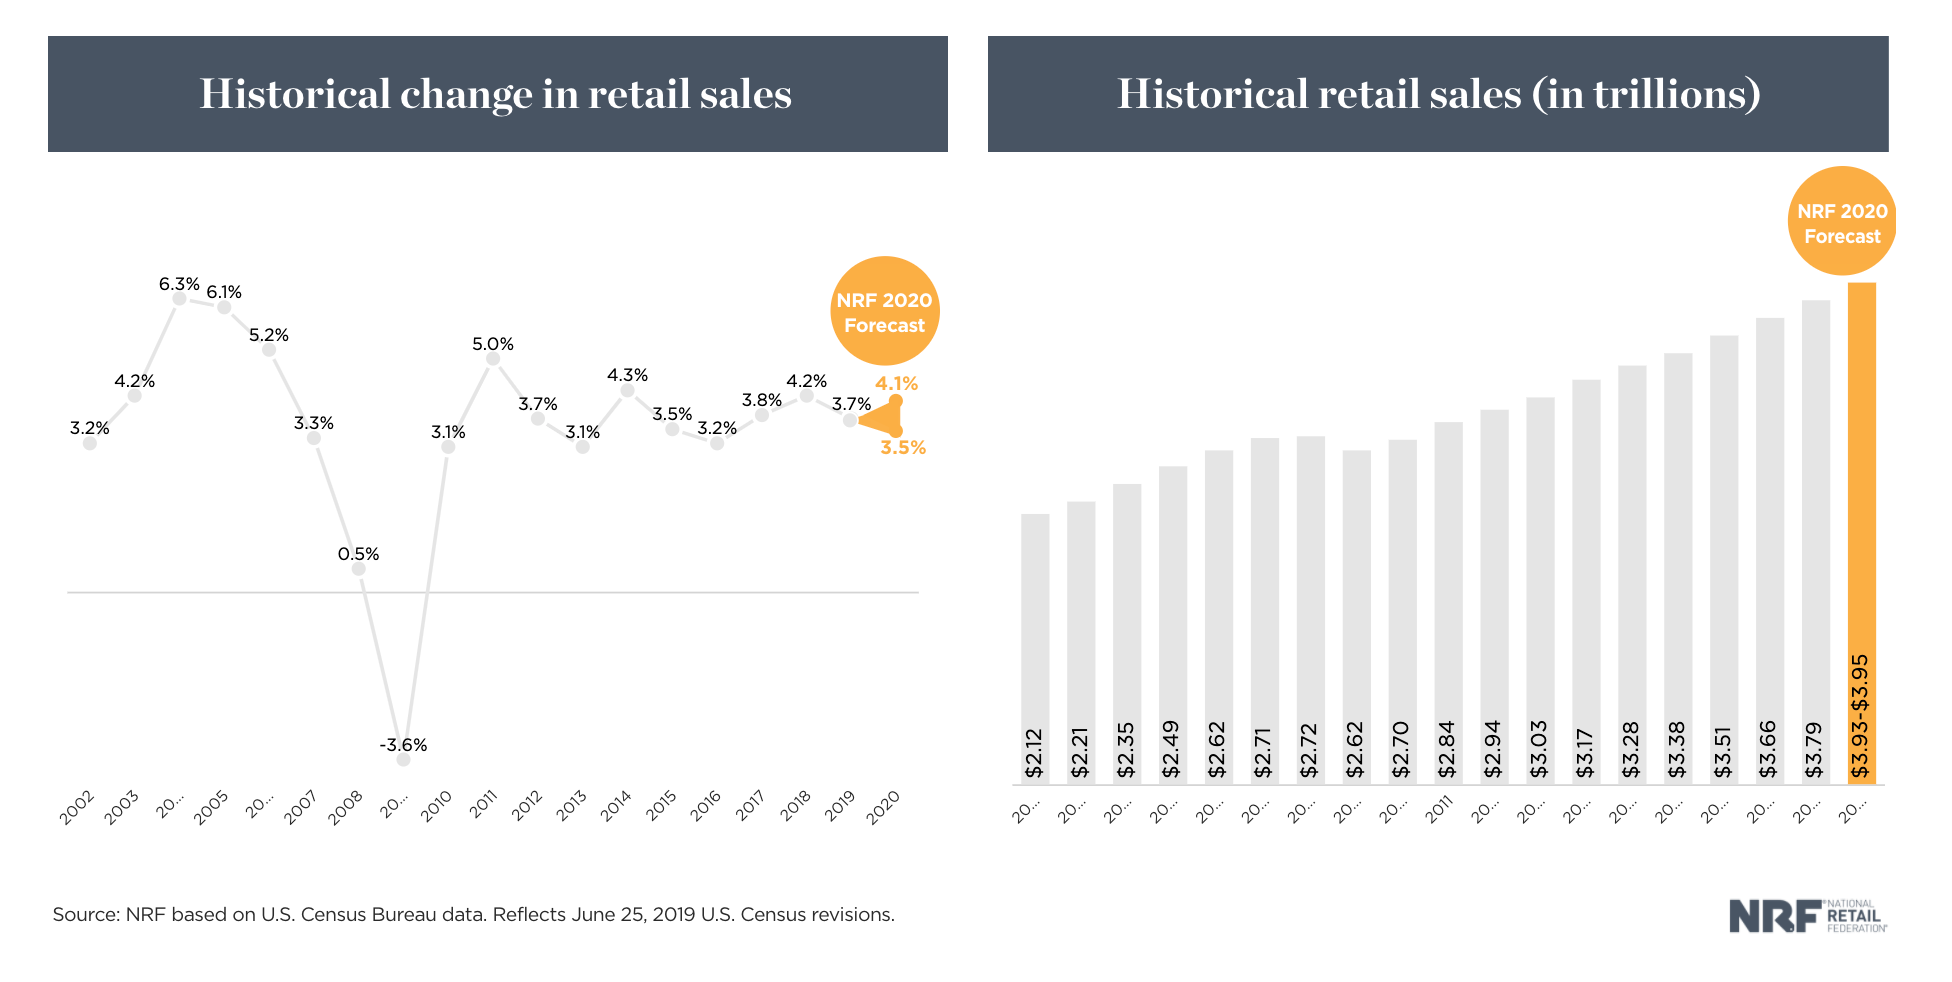
According to the U.S. Department of Commerce, the U.S. retail industry grew by 4.7% year-over-year from January 2019 to January 2020, based on seasonally adjusted estimates from the U.S. Census Bureau’s February 2020 Advance Monthly Sales for Retail Trade and Food Services report.
Related: People Counters & People Counting: Everything You Need to Know
This 4.7% growth in retail sales exceeded the previous year’s growth figure of 3.7% based on preliminary results from 2019, according to a February 2020 press release by the National Retail Federation (NRF).
In addition to overall growth, the Census Bureau retail report also revealed key takeaways regarding specific retail industries:
Constant growth
- The grocery stores segment has shown consistent year-over-year growth since 1998, with a modest 1.5% increase from January 2019 to January 2020.
- Similarly, beer, wine and liquor stores have followed a constant upward trend since 2003, growing an impressive 4.4% year-over-year from January 2019 to January 2020.
- Clothing and clothing accessories stores have also shown a constant upward trend since January 2009, after the industry recovered from the effects of the 2008 recession. Clothing and accessories retail sales had a sharp rise of 7.0% from January 2011 to January 2012 and have followed more modest growth since then, with a 1.8% increase year-over-year from January 2019 to January 2020 (compared to 1.6% from January 2018 to January 2019).
- Automobile and other motor vehicle dealers have also shown constant growth since January 2009, with an impressive 6.9% growth year-over-year from January 2019 to January 2020, compared to the 0.2% growth from January 2018 to January 2019.
- Sales for building material & garden equipment and supplies dealers have grown consistently for the past decade, with a modest 1.0% growth year-over-year from January 2019 to January 2020.
Growth following a brief downturn
- Shoe stores dropped 3% year-over-year from January 2017 to January 2018 for the first time since the 2008 recession, then increased by 10% from January 2018 to January 2019, with a modest increase of 0.5% from January 2019 to January 2020.
- Jewelry stores dropped 5% year-over-year from January 2018 to January 2019, but the industry picked back up with an impressive 10.1% increase from January 2019 to January 2020.
- Furniture and home furnishings stores dropped 2.4% year-over-year from January 2018 to January 2019 for the first time since the 2013-2014 period but picked back up with a 5.6% growth year-over-year from January 2019 to January 2020.
- Sporting goods, hobby, musical instrument, and book stores came back with a respectable year-over-year increase of 2.5% after a three-year downward trend starting in the January 2016-January 2017 period.
Constant decline
- Department store sales dropped 5.6% year-over-year from January 2019 to January 2020, continuing the constant downward trend seen for more than a decade.
It should be noted that, from January to February 2020, overall sales in the U.S. retail industry dropped 0.5%, with retail sales falling for just about every category, according to the Census Bureau. This downturn reflects the industry’s largest decline since December 2018’s 1.2% drop. This was also the second time U.S. retail sales fell in the past six months, following a 0.3% drop in September 2019.
While it is too soon to estimate the impact of the coronavirus pandemic on the retail industry’s 2020 outlook (this article was published on March 25th), it is clear that previous retail projections for the year will have to be revised to account for this unexpected worldwide event.
2- A closer look at retail industries worldwide
While trends in U.S. retail industry sales growth tell part of the picture, it’s also worth taking a look at the state of global retail. POS software company Vend’s Retail Benchmarks Report 2019, based on worldwide retail data from independent stores gathered between March 31, 2018 and March 31, 2019, offers key retail benchmarks.
Average figures
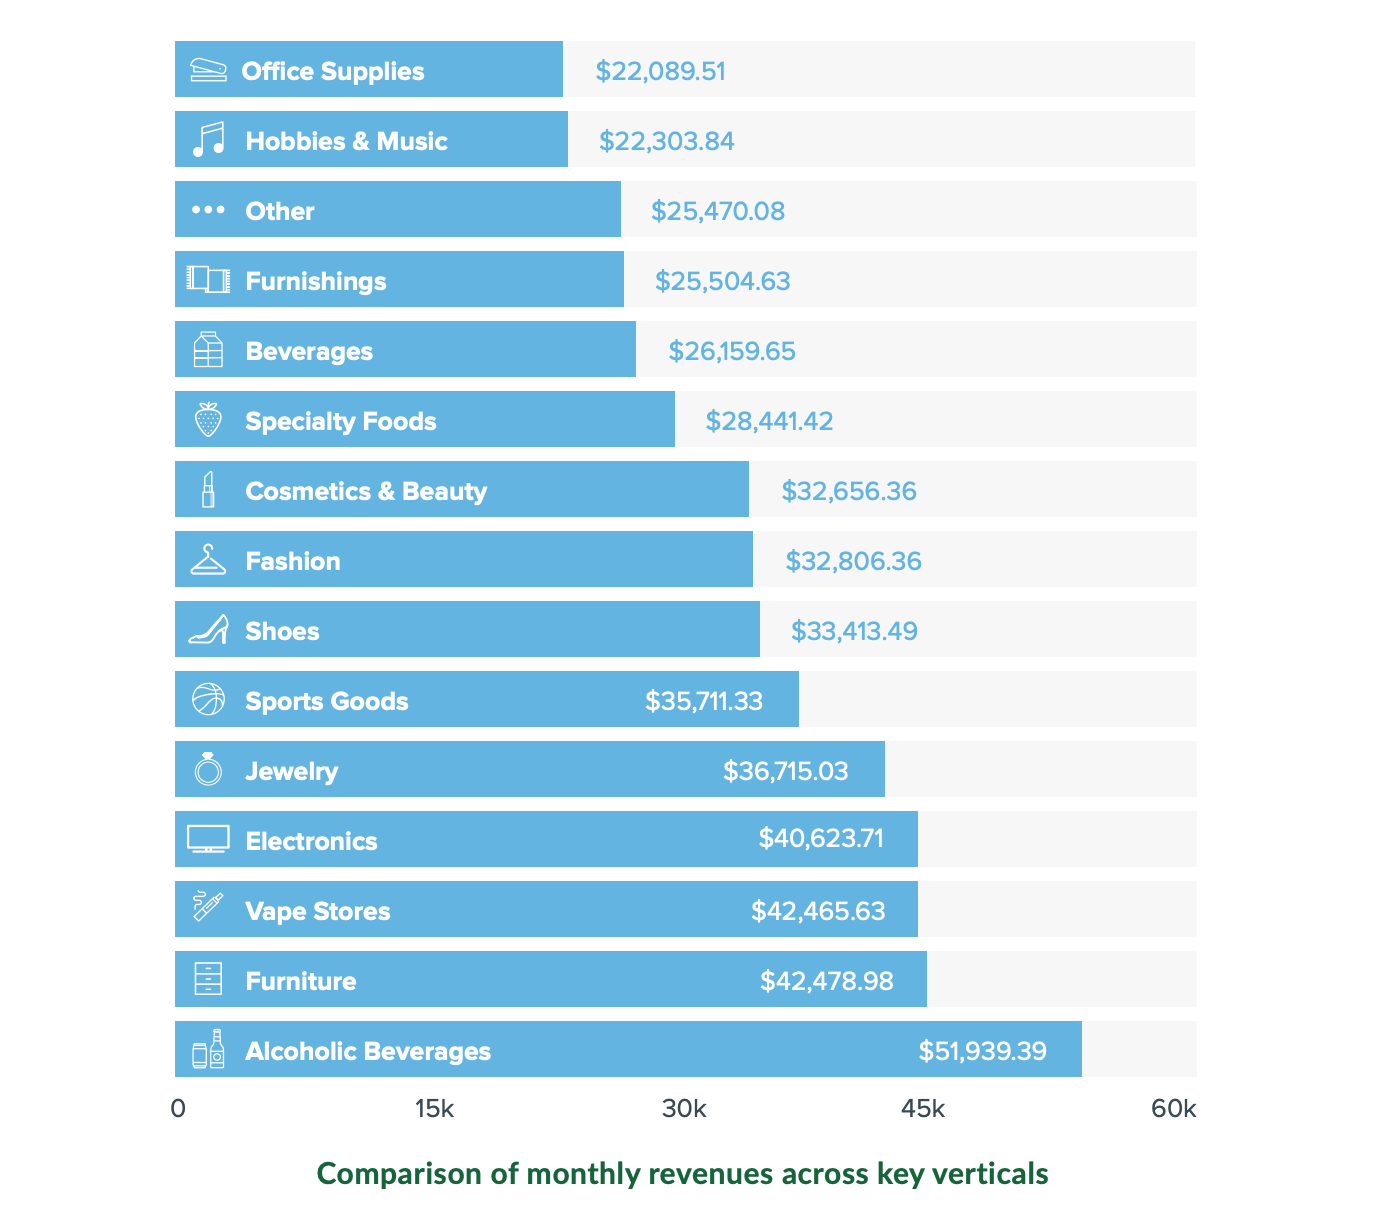
- The average global monthly revenue was a little over $28,000 for independent stores.
- The average gross margin in retail was 53.33%.
- The average transaction value was $54.14, with retailers in the study processing an average of 651.5 transactions across all stores.
Top performers
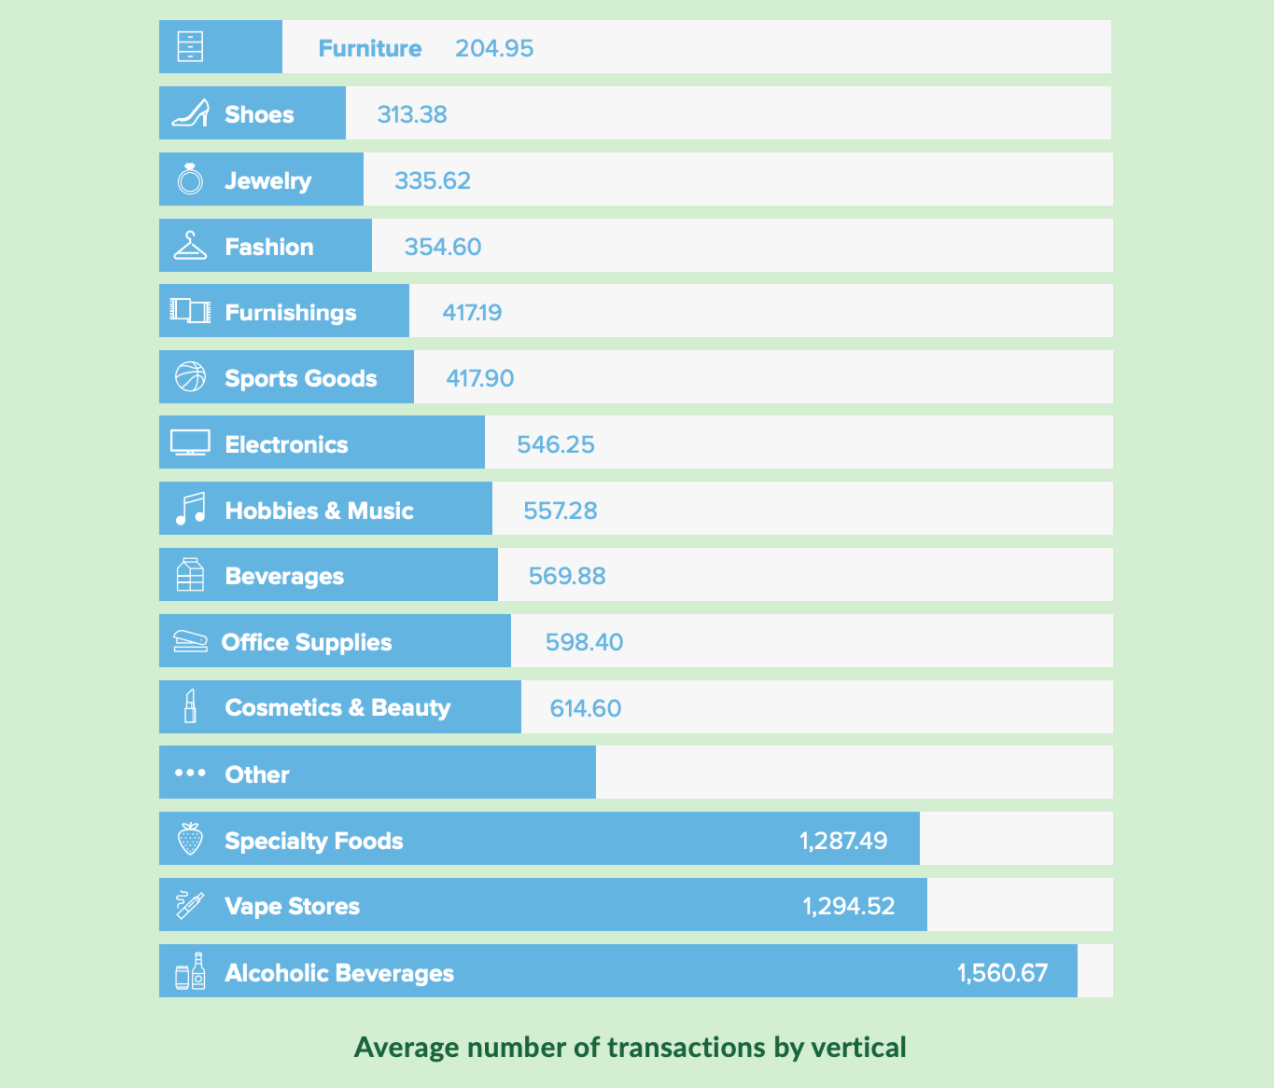
- Beer, wine and liquor stores had the highest gross revenue at nearly $52,000 per month, which is consistent with the trend of growing sales in the U.S. (as mentioned in Section A). These stores also had the highest transaction counts at nearly 1230 per month.
- Furniture stores came in second place for highest gross revenue, earning close to $42,500 per month. Although they did not have the highest transaction counts, they did have the highest average transaction value (ATV) at $222.81.
Industries to note
- Retailers in the hobbies and musical instruments space had some of the lowest gross monthly revenue at a little over $22,000.
- Despite their overall success, beer, wine and liquor stores also had the lowest margins at 35.64%.
- Last but not least, furniture stores and shoe stores had some of the lowest transaction counts at 204.95 and 313.38, respectively.
3- Holiday shopping stats
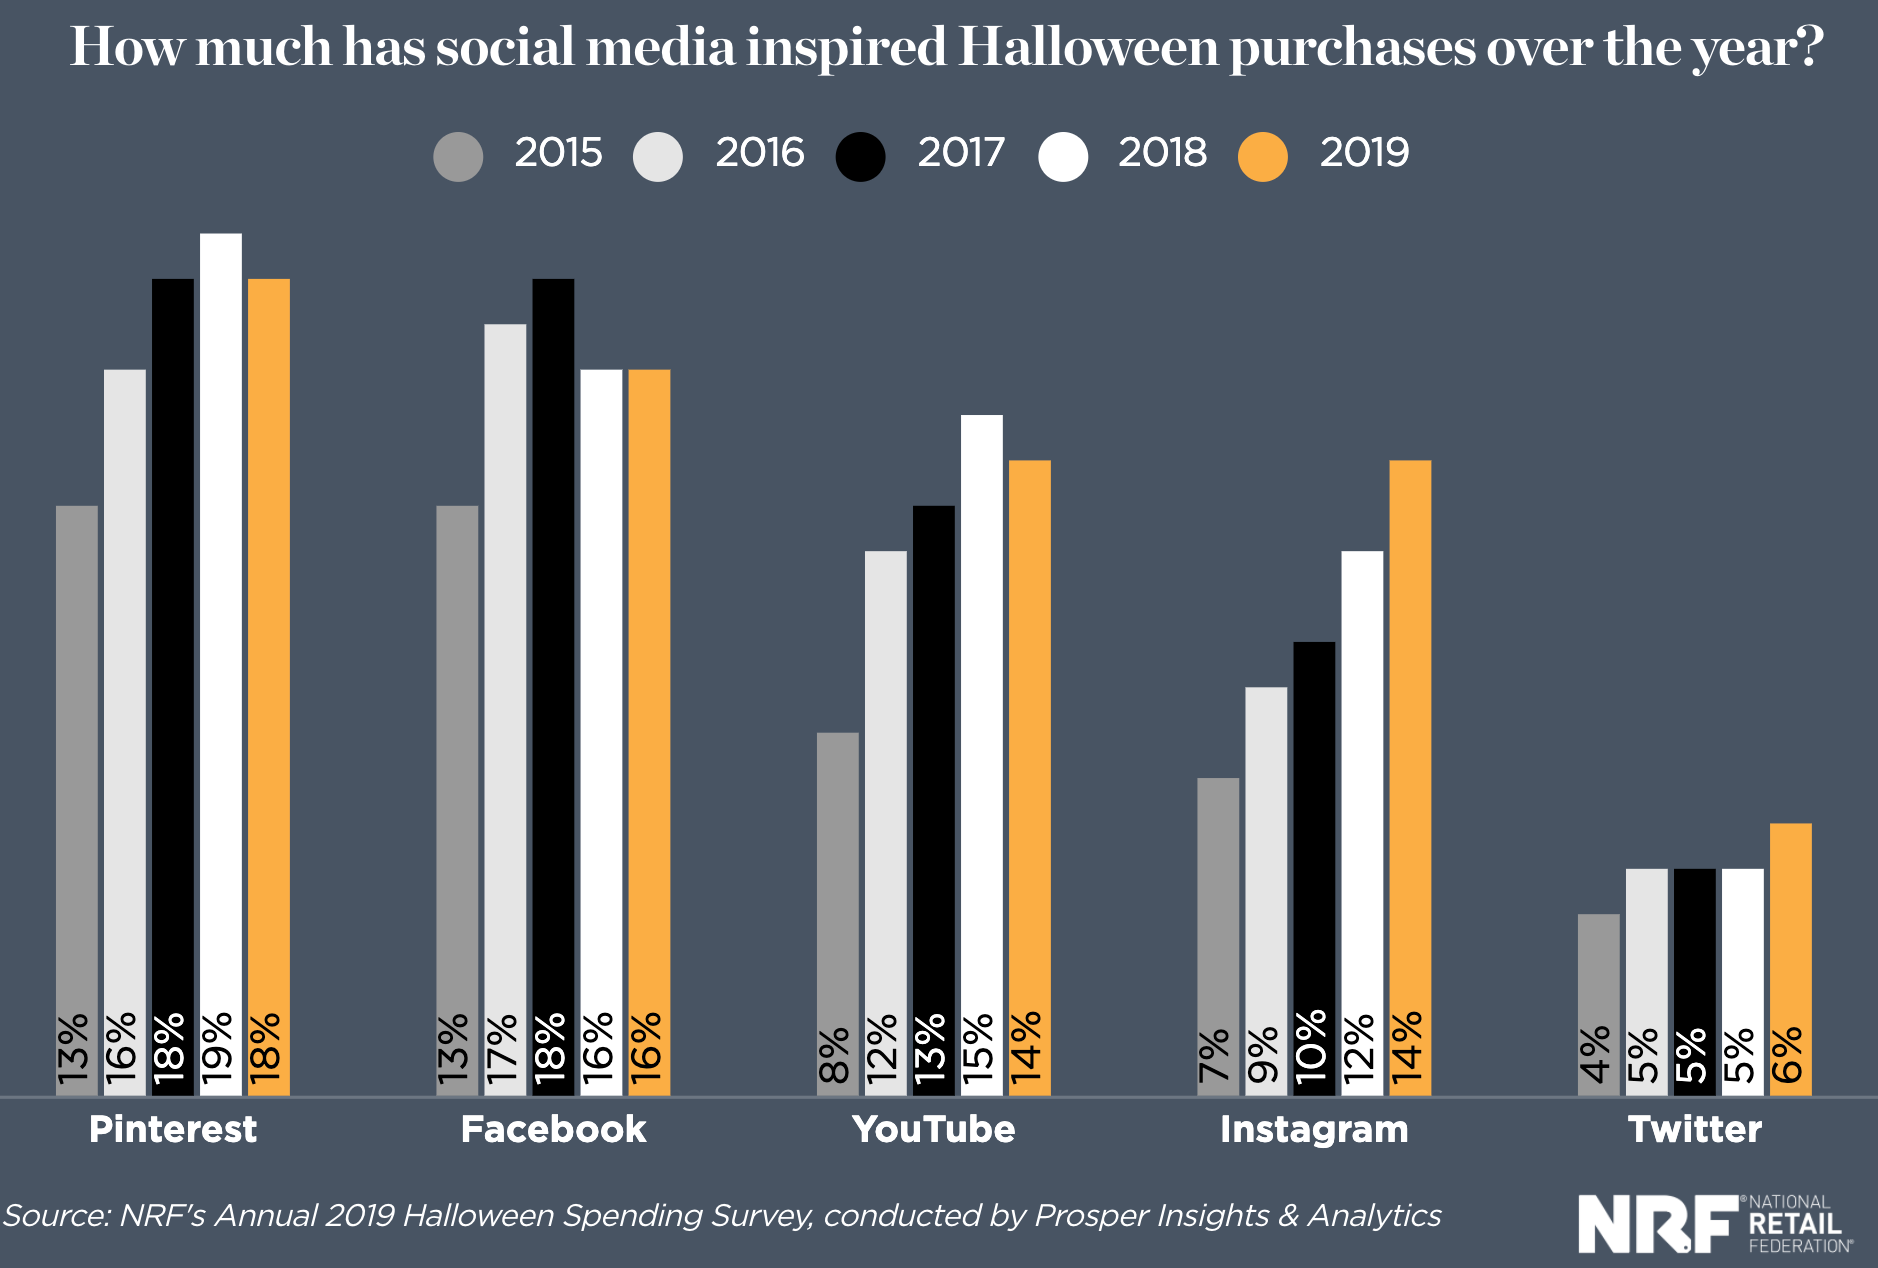
Halloween
Conducted by Prosper Insights & Analytics, the NRF’s Annual Halloween Spending Survey estimated that Halloween spending would reach $8.8 billion in 2019, which is lower than the 2018 estimate of $9.0 billion. Similarly, celebrants indicated plans to spend an average of $86.27, slightly lower than the previous year’s $86.79.
Retail research from the past two years has revealed that survey respondents are quite consistent with their Halloween purchasing decisions: 95% of them planned to purchase candy (reflecting estimated spending of $2.6 billion), 72% decorations ($2.7 billion), and 67% costumes ($3.2 billion).
The 2019 survey also indicated that 42% of respondents intended to do their Halloween shopping at a discount store, while 36% planned to visit a specialty Halloween or costume store.
Thanksgiving weekend
According to the NRF’s 2018 In-Store Holiday Shopping Survey conducted by Natural Insight, 49% of shoppers said their top stressor was not finding presents that fit within their budget. Perhaps this explains the popularity of sales events such as Black Friday: While many respondents rated this day as a bad shopping experience—which makes sense given that 65% of respondents rated crowded stores as a main cause of stress during holiday shopping—20% of respondents still said they planned to do most of their holiday shopping on Black Friday to take advantage of retail holiday sales.
Similarly, responses to the NRF’s 2019 Annual November Holiday Consumer Survey conducted by Prosper Insights & Analytics indicated that Black Friday was the most popular shopping day over the Thanksgiving weekend, with 114.6 million consumers (69% of respondents) planning to do their shopping on Black Friday, followed by 68.7 million (42% of respondents) seeking online deals on Cyber Monday.
Indeed, the NRF’s 2019 Annual Thanksgiving Weekend Consumer Survey, also conducted by Prosper Insights & Analytics, found that 189.6 million consumers in the U.S. shopped between Thanksgiving Day and Cyber Monday in 2019, reflecting an increase of 14% over the 165.8 million people who shopped in 2018. NRF’s retail research indicates that, of these, 124 million shopped in-store, 142.2 million went online, and 75.7 million did both.
The retail report also found that shoppers spent an average of $361.90 at retail holiday sales over the five-day period, up 16% from last year, with 71% (or $257.33 on average) spent specifically on gifts.
Winter holidays
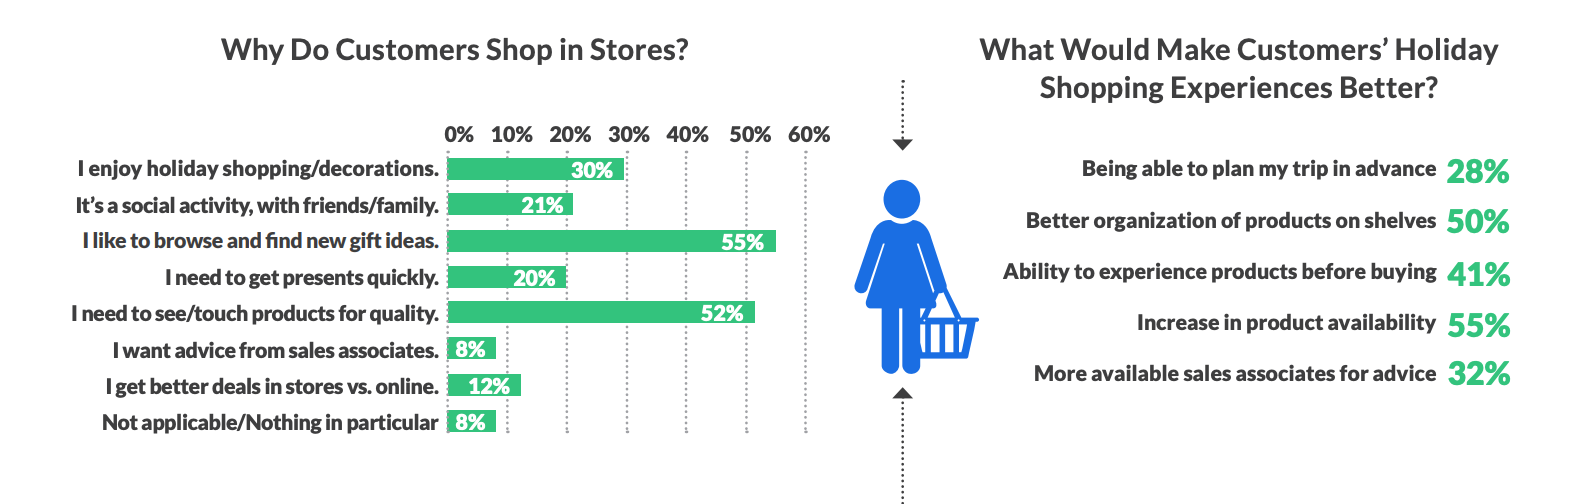
According to the NRF’s 2018 In-Store Holiday Shopping Survey, 88% of respondents said they intended to shop in-store for the holiday season, citing their desire to “browse and find new gift ideas” as the number one reason for preferring to visit a physical store. A third of the respondents also said they enjoy the holiday decorations that accompany retail holiday sales, so it’s a good idea for retailers to equip their stores with festive décor during this time.
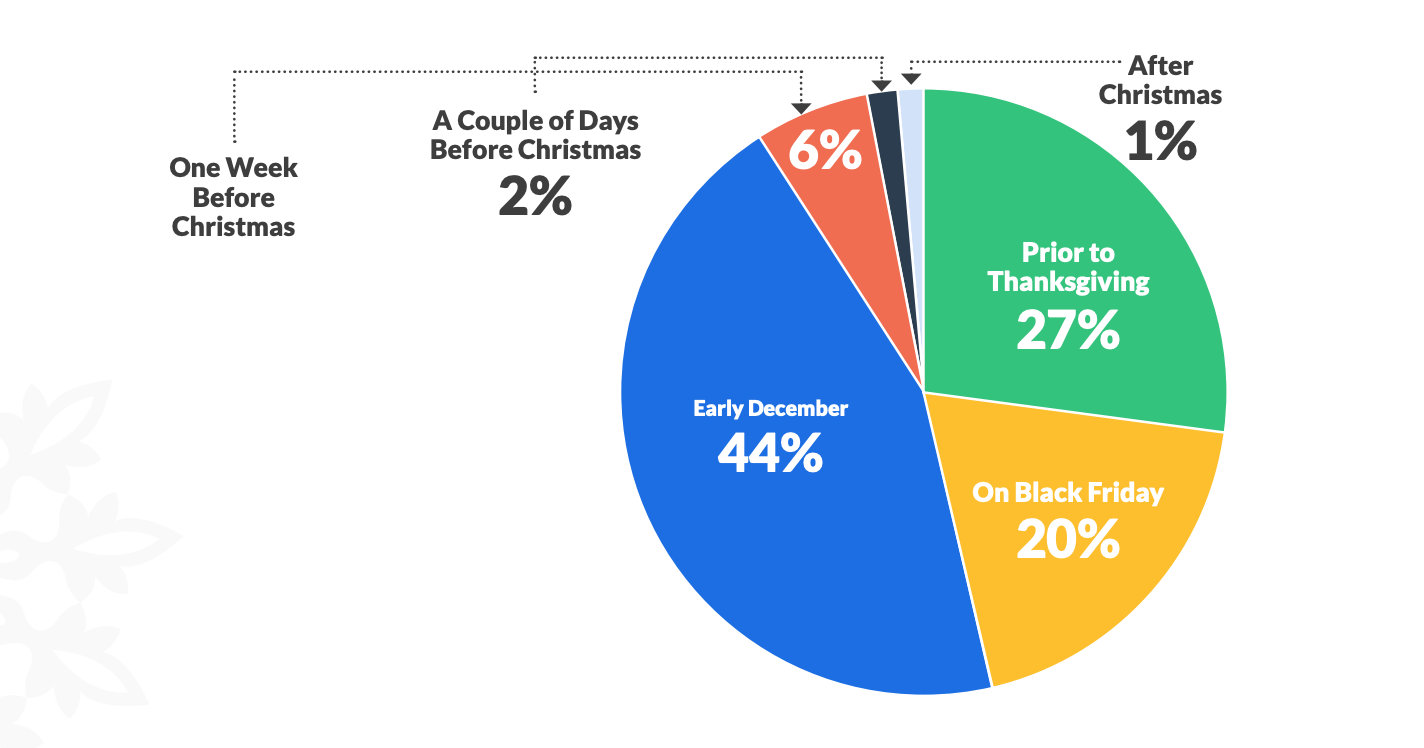
Retail research also provided insights regarding when consumers prefer to hit up retail holiday sales: 47% of respondents said they would do their holiday shopping before December, while 44% said they would do it in early December. This makes sense when you consider that 25% of respondents rated shopping as their top stress factor over the holidays.
Indeed, the NRF’s Annual November Holiday Consumer Survey, conducted the following year by Prosper Insights & Analytics, found that more than half of the consumers surveyed—56%—had already begun their holiday shopping early in November, purchasing 24% of the items on their list, a record in the history of the survey.
In the end, 2019 holiday retail sales grew by 4.1% compared to the same period in 2018, reaching $730.2 billion in total, according to a January 2020 press release from the NRF.
4- What about e-commerce?
E-commerce stats in 2019
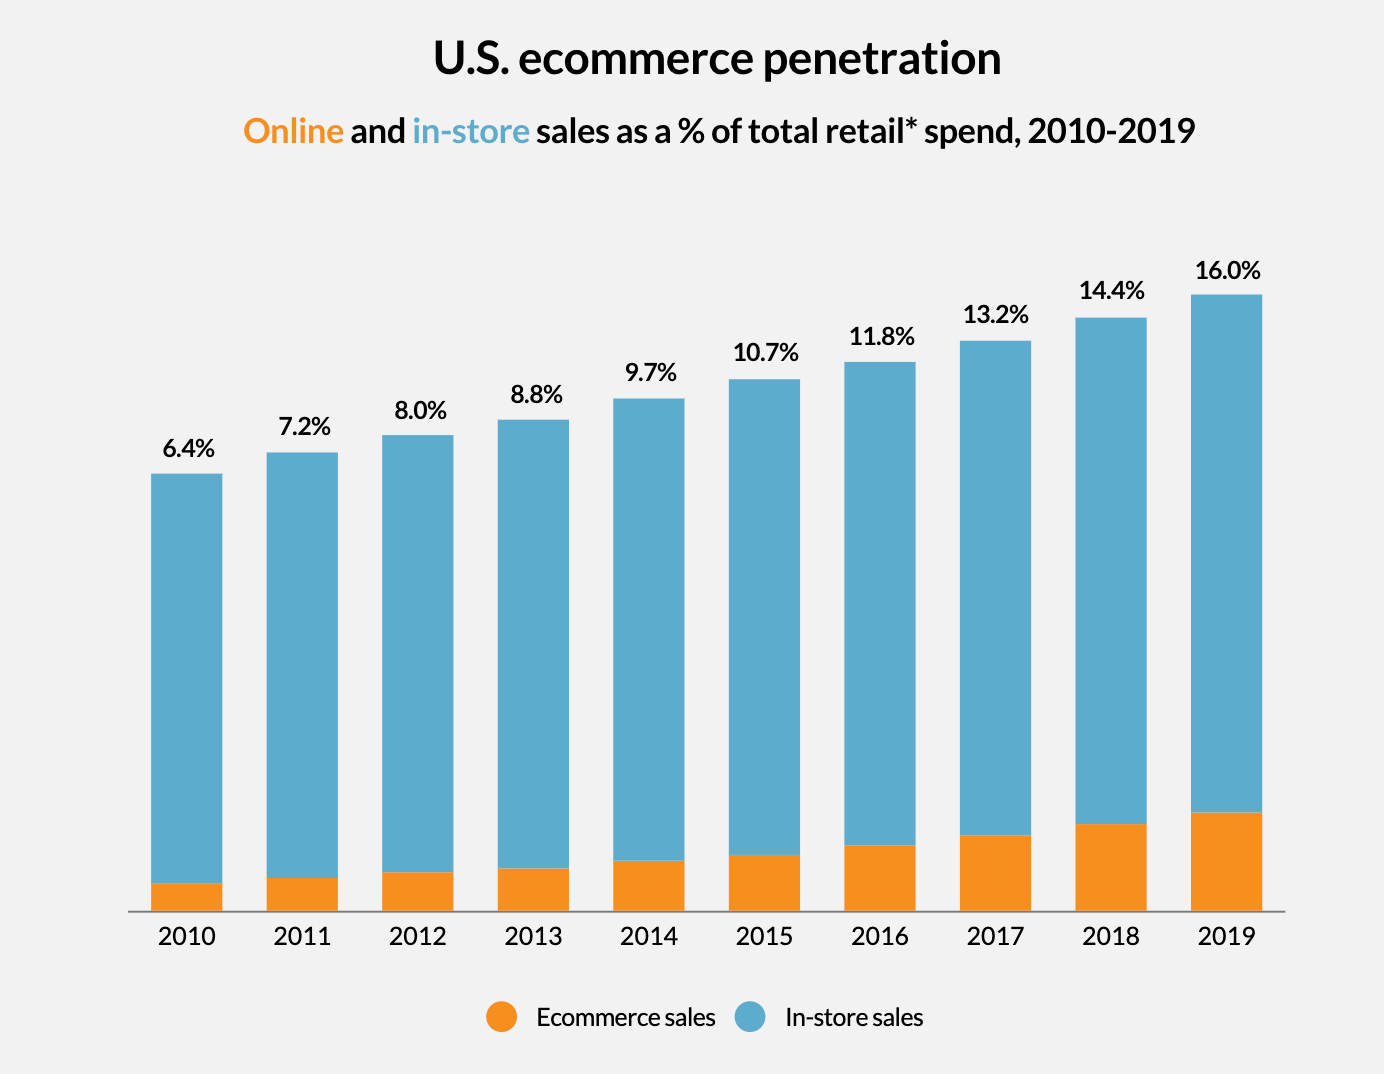
In 2019, online spending accounted for $601.75 billion, or 16% of total retail sales, according to Digital Commerce 360’s analysis of U.S. Census Bureau statistics. This 16% jump was the biggest in the survey’s history since it began tracking e-commerce spending in 2000.
According to the NRF’s 2019 Annual October Holiday Consumer Survey, more than half of shoppers (56%) intended to shop online for the holidays, with 92% planning to take advantage of free shipping, compared to 48% who planned to use "buy online, pick up in-store" or similar services. The retail report also found that same-day delivery was the shipment method of choice for 16% of the respondents, doubling the figure from 2015.
Indeed, e-commerce did prove to be king during the 2019 holiday season, as eMarketer’s U.S. Holiday 2019 Review reported that Cyber Monday broke a record for online spending, jumping 19.7% to reach $9.4 billion. The success of Cyber Monday only narrowly beat out Black Friday, which jumped 19.6% to reach $7.4 billion in spending.

According to a January 2020 press release by the NRF, online and other non-store sales grew by 14.6% compared to the 2018 holiday season, reaching $167.8 billion in total.
In February, the NRF estimated that online sales would grow by 12-15% in 2020 to reach the $870-893 billion range.
Online vs. in-store sales in 2019
The Digital Commerce 360 retail report also revealed that e-commerce accounted for an impressive 56.9% of all gains in the retail market in 2019, making it the third year in the history of U.S. retail that the year-over-year gains for online spending exceeded those for in-store.
According to eMarketer, e-commerce also beat out brick-and-mortar sales in terms of growth during the 2019 holiday season, with the former growing 13.2% to reach $137.55 billion while sales via physical stores grew at a more modest rate of 2.4% to reach $869.40 billion.
5- Amazon’s impact on physical stores
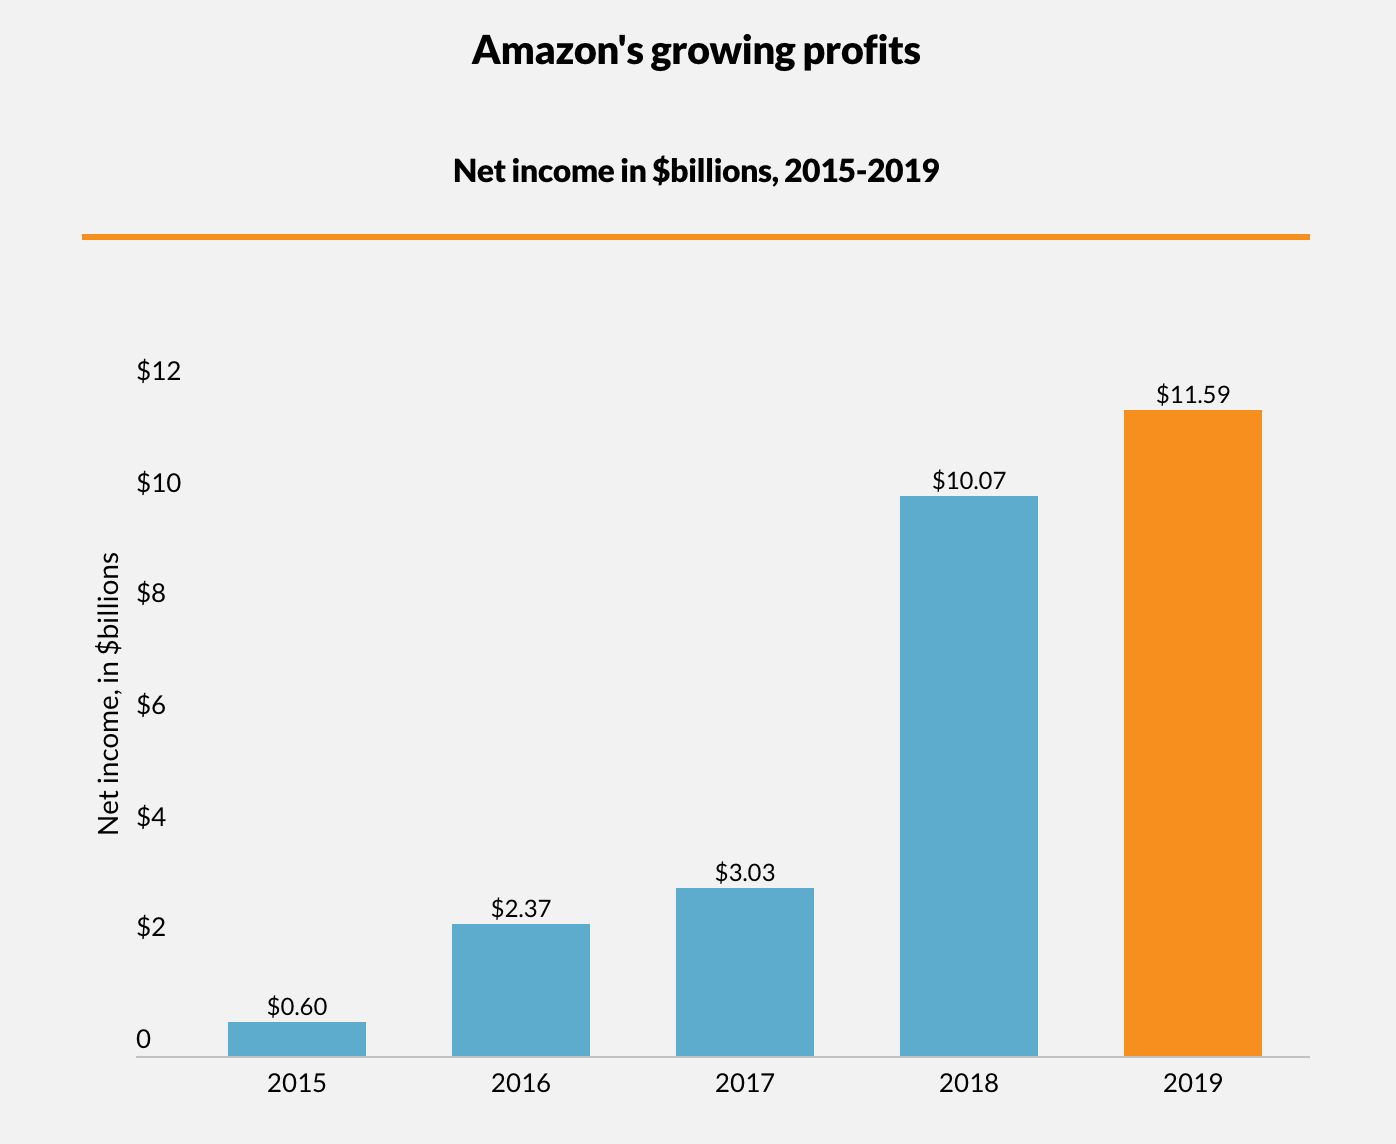
As the list-topper in the 2019 Digital Commerce 360 Top 1000 report, Amazon continued its steady growth in 2019 with a 20.5% revenue increase across all segments to generate $280.52 billion in total.
The retail research by Digital Commerce 360 revealed that $141.25 billion in Amazon’s 2019 sales came from online stores, reflecting an increase of 14.8% over 2018. By contrast, sales through the retailer’s physical stores such as Whole Foods and Amazon Go were down 0.2%, although they still managed to generate $17.19 billion for the retail giant.
As the prevalence of Amazon—as well as features like Amazon Prime and 1-day shipping—inevitably shifts customers toward a more digital shopping experience, physical stores are struggling to keep up.
Mirroring the continued decline of sales figures at U.S. department stores, brands like Macy’s are feeling the brunt of Amazon’s unrivaled growth, Investopedia reported. Macy’s experienced a gradual drop in stock prices long before it had to shutter its stores due to the coronavirus pandemic—and it wasn’t the only one. After Amazon announced in mid-2018 that it would acquire online pharmacy PillPack, shares of pharmacy chains such as Walgreens, CVS, and Rite-Aid plummeted.
This isn’t all to say the future is doomed by Amazon, of course. Brick-and-mortar stores looking to compete in the marketplace must instead look to Amazon’s meteoric rise and see what they can learn from it.
As shopping on the whole becomes more digital, it’s vital for these stores to begin using data to understand their customers and continue to evolve in an ever-changing marketplace.
Hi there! If you liked this post, please feel free to share it on social media to help us reach out to more retailers like you. You can also leave a comment below and let us know if you have any questions!
Start counting your foot traffic now
Get data faster with the world’s first thermal-sensing, battery-operated people counter