In July, U.S. brick-and-mortar retail visits grew 1.7% year over year. In August, growth slowed to just 0.3%, according to Placer.ai's August 2026 Retail and Dining Index (published September 15).
Did shoppers suddenly lose interest? Not exactly. Placer.ai points to a big piece of the answer: the calendar. Labor Day fell on September 1 in 2025, so the start of that holiday weekend landed in August. In 2026, Labor Day fell on September 7, which pushed the whole weekend into September.
Same shoppers. Different calendar. Very different number.
Now picture that same mistake inside your store, in November and December, when every hour of labor counts. That is why retail traffic forecasting matters more this holiday season than it has in years. Here is what is changing, and a simple way to build a forecast you can actually staff against.
What is retail traffic forecasting?
Retail traffic forecasting means predicting how many people will walk through your door, by day and by hour, so you can plan staffing, checkout coverage, and promotions before the rush arrives.
It is not the same as a sales forecast. Sales tell you what happened after shoppers decided to buy. Traffic tells you how many chances you had. If you only forecast sales, you plan around the people you already converted and ignore the ones you might lose.
A good traffic forecast answers three questions:
- How many visitors should I expect on each day of the season?
- When will they arrive, hour by hour?
- How confident am I, and what could push the number up or down?
Why forecasting matters more in 2026
Retailers are hiring more carefully this year, which leaves less room for error.
On September 23, outplacement firm Challenger, Gray & Christmas projected that U.S. retailers will add about 450,000 seasonal jobs in the fourth quarter. That would fall below last year's 461,500, which was already the smallest seasonal gain since 2008. Challenger notes that several big retailers that usually announce hiring targets early have not done so, and that many are leaning on existing associates and on-demand labor pools instead of large seasonal hiring waves.
Andy Challenger described the approach as restocking staffing plans "surgically."
Surgical staffing only works if you know where to cut. With fewer extra hands on the floor, a missed peak is not a small inconvenience. It is a line at the register, a shopper who walks out, and a sale you already paid to attract.
Research backs this up. In a well-known study published in Production and Operations Management, Mani, Kesavan, and Swaminathan analyzed hourly traffic, sales, and labor data from 41 stores of a large retail chain. All 41 stores were systematically understaffed during a three-hour peak period, and the authors found that fixing it could significantly increase sales and profitability. They also identified forecasting errors as one of the drivers of that understaffing.
In other words, bad forecasts do not just waste payroll. They cost you sales at the exact hours that matter most.
Why last year's numbers can mislead you
The most common forecasting method in retail is also the riskiest: take last year's number for the same date and add a few percent. It feels safe. It often is not. Three forces break that shortcut.
1. The calendar shifts every year
Dates move against days of the week, and holidays move against dates. The Labor Day swing in Placer.ai's August data is one example. The 2026 holiday season has several more:
- Thanksgiving falls on November 26 this year, versus November 27 in 2025. That gives you 29 days from Thanksgiving to Christmas instead of 28.
- Christmas Day lands on a Friday (it was a Thursday last year), so Christmas Eve is a Thursday and the post-holiday weekend starts right away.
- The last Saturday before Christmas is December 19, versus December 20 last year.
- Halloween falls on a Saturday in 2026, versus a Friday in 2025.
If you compare December 19, 2026 against December 19, 2025, you are comparing a Saturday to a Friday. Your forecast will be wrong before you start.
The fix is to compare like days to like days. That is exactly why the retail industry uses the NRF 4-5-4 calendar, which the National Retail Federation says is designed to line up holidays and keep the same number of Saturdays and Sundays in comparable months. For your own traffic forecast, match each day to the same weekday and the same position relative to the holiday (for example, "the second Saturday after Thanksgiving"), not the same date.
2. Weather and local events move traffic
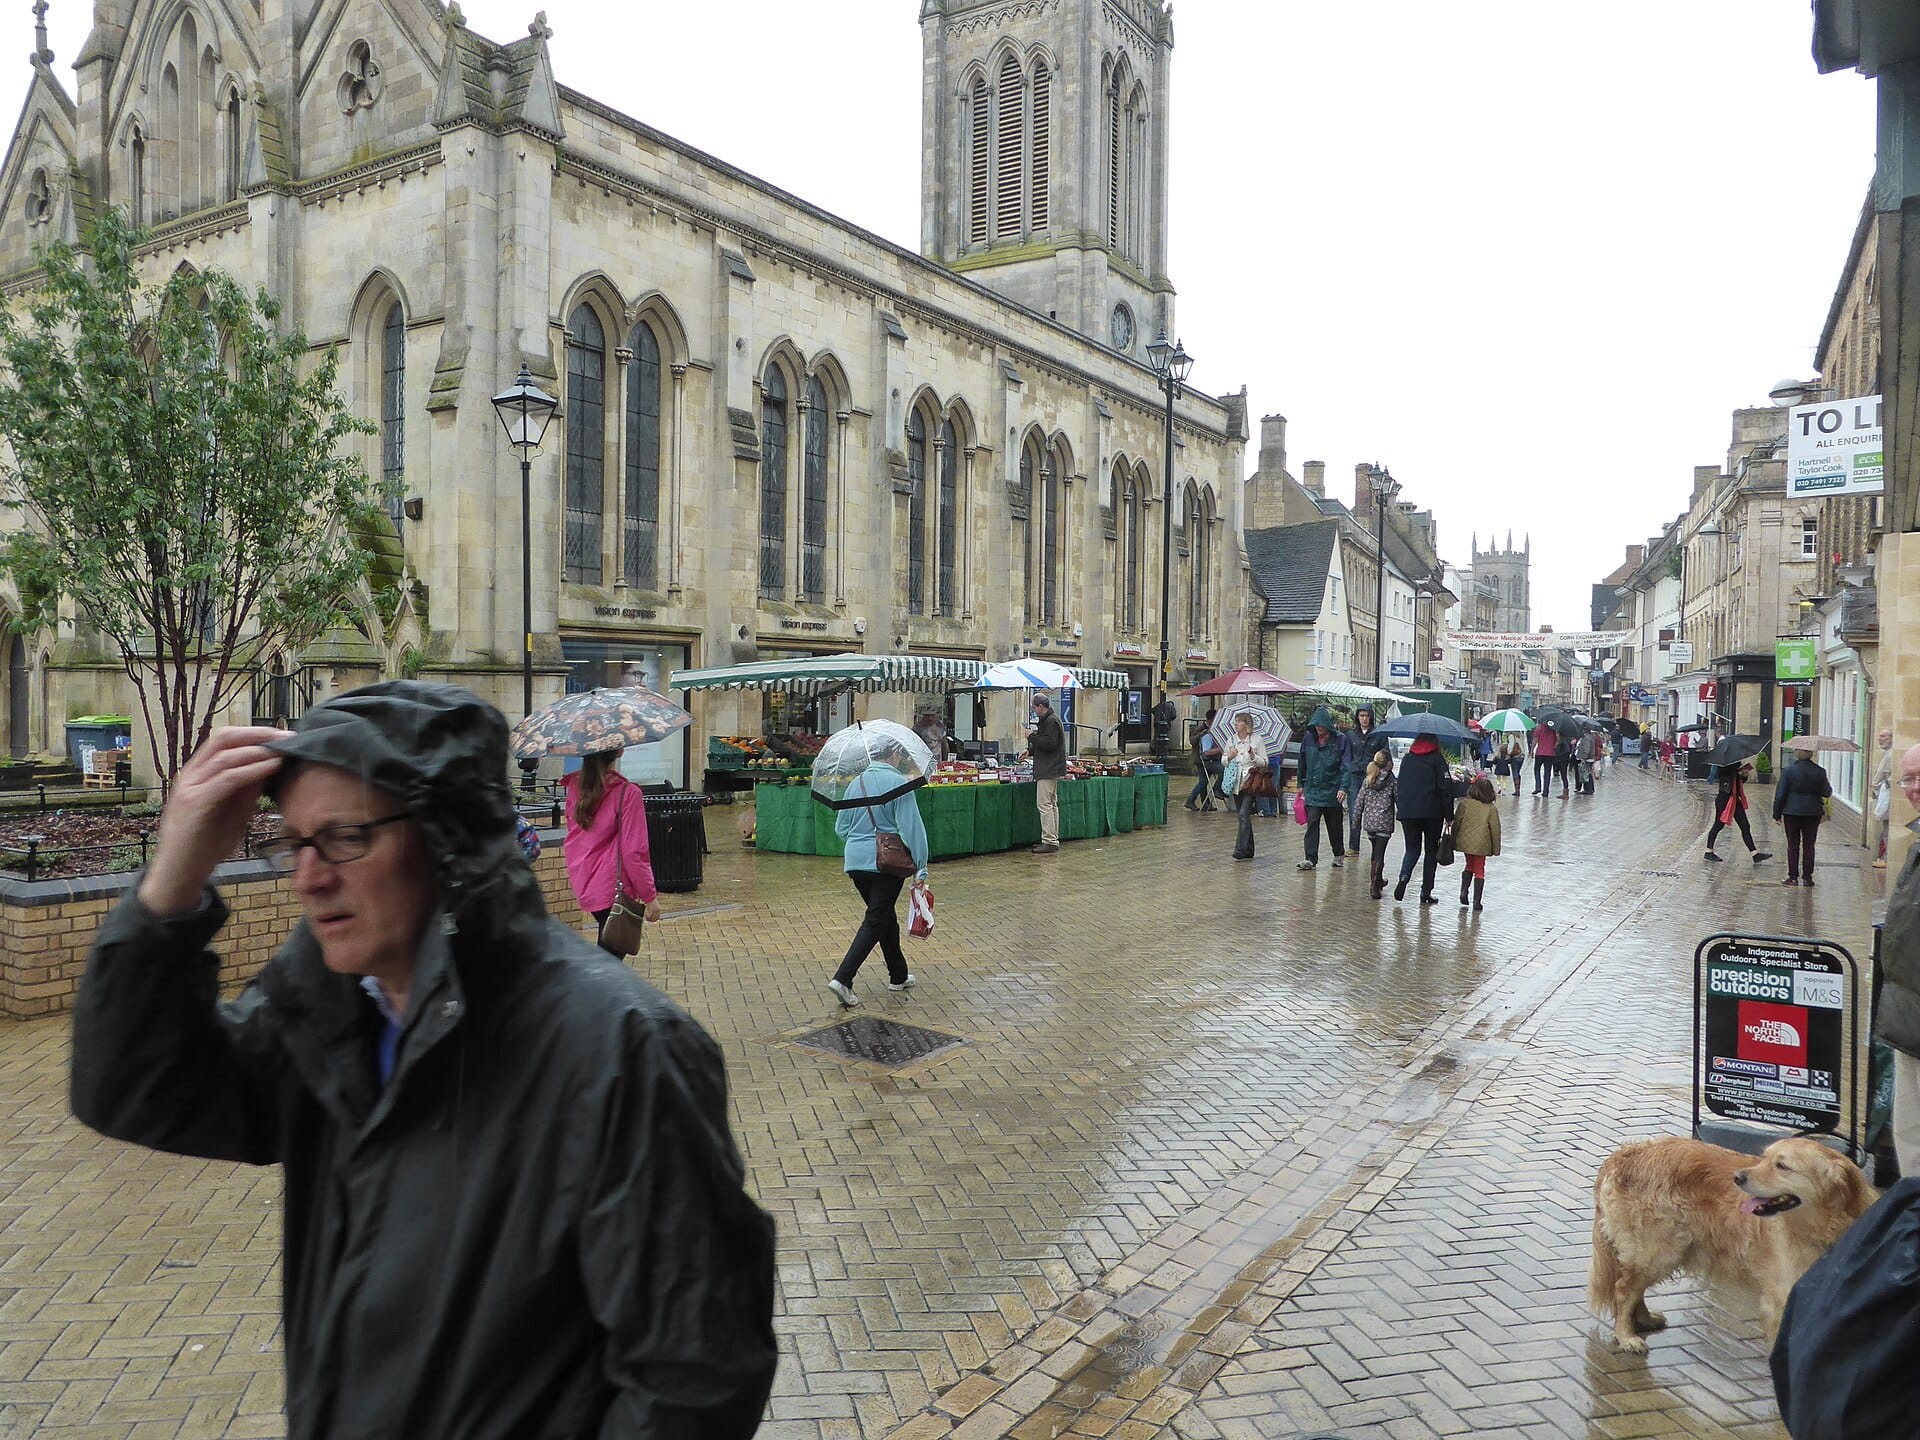
Placer.ai also noted that heavy rain and severe storms across the Northeast and Great Lakes in late August may have added pressure to retail visits in those regions. One stormy weekend can drag down a whole month's comparison, then make the next year look like a boom.
When you build your baseline, flag the unusual days: storms, road closures, a big local game, a community festival, a competitor's grand opening. Do not let a one-off become part of your "normal."
3. The economy is not the same everywhere
In August, Placer.ai found retail visits grew in much of the West and South but fell across much of the Midwest and Northeast. A national number is context. Your own trend is what you should forecast from.
How to build a simple retail traffic forecast
You do not need a data science team. You need clean traffic data and a consistent process. Here is a five-step method you can run this week.
Step 1: Build a clean baseline
Start with your actual hourly visitor counts. Ideally you have a full year, so you can see last holiday season. If you do not, use what you have and plan to refine as the season unfolds.
Remove or flag the outliers you identified above, so your baseline reflects a typical version of each day.
Step 2: Align by day of week and holiday
Map each day of this season to its true comparable day from last year. Black Friday to Black Friday. The last Saturday before Christmas to the last Saturday before Christmas. The Monday after Thanksgiving to the Monday after Thanksgiving.
This one step removes most of the calendar noise that fooled the August headline numbers.
Step 3: Apply your own recent trend
Look at your last six to eight weeks of traffic compared to the same aligned weeks last year. If you are running 4% below last year, start your holiday forecast 4% below last year's aligned days. If you are up, adjust up.
Use your trend, not the industry's. A store in a fast-growing suburb and a store in a shrinking downtown can move in opposite directions in the same month.
Step 4: Layer in what you already know
Your forecast should include the things on your own calendar:
- Promotions and events you have planned, and how similar events performed before.
- Extended holiday hours, which spread traffic across more hours rather than always adding it.
- Seasonal shopping that starts early. The NRF's 2026 Halloween survey found that 49% of consumers planned to start shopping in September or earlier, so seasonal traffic can build weeks before the holiday itself.
Step 5: Turn traffic into a staffing plan, then check your error
A forecast is only useful when it becomes a schedule. Divide your forecast visitors per hour by the number of shoppers one associate can serve well in an hour at your store. That gives you a coverage target for every hour of the season.
Here is a simple illustration with made-up numbers. Say your data shows one associate can comfortably serve about 25 shoppers an hour, and you forecast 150 visitors between 1 p.m. and 2 p.m. on the last Saturday before Christmas. You need about six people on the floor for that hour, plus checkout coverage. If your forecast for 9 a.m. is 30 visitors, one or two people may be enough.
Then, every week, compare your forecast to what actually happened. If you forecast 1,000 visitors and got 900, you were off by 10%. Track that error by day and by hour. When it grows, find out why, and adjust the next week's plan.
This is where many forecasts quietly fail. They are built once in October and never checked again.
How people counting data makes your forecast trustworthy
Every step above depends on one input: accurate, hour-by-hour traffic counts. And that is where many stores come up short.
- POS data is not traffic data. Transactions only show the people who bought. They hide every visitor who walked in, could not find help, and left. Forecast from transactions and you will plan for your converted shoppers, not your real crowd.
- Manual clicker counts are inconsistent. They vary by who is counting and usually cannot be broken down by hour.
- National data is too broad. It is great context, but it cannot tell you when your own door gets busy.
Door-level people counting fills the gap. With a year of accurate hourly counts, you can align days, measure your own trend, and track forecast error without guesswork. Pair those counts with your POS data and you also see conversion by hour, which tells you whether your forecast-based staffing is actually turning visits into sales. If you are new to reading this kind of data, our complete guide to foot traffic analytics covers the basics.
Where Dor fits
This is the kind of work Dor was built for. Dor is a thermal, battery-operated people counter that peels and sticks above your entrance, ships in days, and installs in minutes, with no wiring, no dependence on your store network, and no cameras capturing personal data.
Once it is counting, the Dor dashboard shows foot traffic, conversion, and revenue by hour and location, and lets you compare date ranges and stores while factoring in seasonality. Dor also connects with POS systems like Shopify, Square, and Lightspeed, so you can see which forecasted peaks your team converted and which ones slipped away. You can learn more on our retail solutions page.
If you are not counting yet, there is still time to capture this holiday season. Even a partial season of accurate data gives you a real baseline for next year, instead of another round of guessing.
Plan the season you will actually get
The August numbers are a useful warning. A national headline can swing on a single holiday weekend, and your store's numbers can too. In a season when retailers are hiring cautiously and leaning on the staff they already have, the stores that win will be the ones that forecast by aligned day and hour, use their own trend, and check their error every week.
Start with your traffic. Align the calendar. Staff to the forecast. Then measure and adjust. For the scheduling side, our playbook on retail peak-hour staffing shows how to build shifts around your curve, and our 2026 holiday preparation guide covers checkout and conversion. You can also see why your busiest day may be your worst day for conversion.
Want to see what your real traffic curve looks like before the rush? Book a demo to see how Dor tracks foot traffic and conversion, or explore pricing and start counting this month.
Sources
- Placer.ai, "August 2026 Retail and Dining Index: Retail Finds Bright Spots as Dining Slips Nationwide" (September 15, 2026)
- Challenger, Gray & Christmas, "2026 Holiday Hiring Outlook: After Lowest Season Since 2008, Will Retailers Stock Up on Workers?" (September 23, 2026)
- National Retail Federation, "NRF Halloween Survey Shows Consumer Spending Expected to Reach $13.5 Billion" (September 22, 2026)
- National Retail Federation, 4-5-4 Calendar
- Mani, V., Kesavan, S., and Swaminathan, J. M. (2015), "Estimating the Impact of Understaffing on Sales and Profitability in Retail Stores," Production and Operations Management, 24(2)